In recent years, green building has become a powerful tool to fight against global warming. Generally, green building is not only a specific construction method but also a gathering of techniques, technologies and equipment which are applied into construction to make it environment friendly. All about green building targets to make a healthy construction by reducing its impact on the environment. A green building has a strong way of recycling, reducing, reusing and renewable resourcing of materials. A green building can reduce water and energy consumption, use eco-friendly building tools, minimize GHG emissions, inspire renewable abstraction, develop the environment with trees and roof gardens, etc. Green buildings help to fight climate change in two ways. Firstly, by performing energy efficiency and secondly, by promoting green communities. If green buildings are established inside any community, it can maximize their impact on a healthy environment undoubtedly.
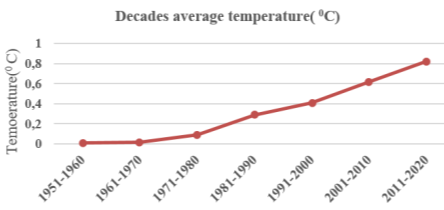
Buildings, transportation, and industries are three well-recognised energy consumption sectors in worldwide (Mardiana & Riffat, 2013). Both trade and residential buildings are responsible for consuming one-third energy of total energy than transport and industries (Gul & Patidar, 2015; Yau & Hasbi, 2013). In developed countries, only buildings are liable to consume 35% - 40% energy of total energy (Gong & Song, 2015). According to the 4th assessment report of the Intergovernmental Panel on Climate Change (IPCC), the emission of CO2 by building sectors was 8.6 billion metric tons in 2004 and it was predicted to arise about 15.6 billion metric tons by 2030 (Metz et al., 2007). After reaching in 2010, the level of CO2 emission was almost grown up to 8.8 billion metric tons for building sectors (Edenhofer et al., 2014). According to the Climate Action Tracker (CAT), globally 27% of energy-related CO2 are emitted and 30% of energy are used for building operation both in manufacturing and constructing (Lebling et al., 2020). Also, the Sustainable Buildings and Climate Initiative (SBCI) predicts that about 33% of GHG emissions and 40% of energy consumption are done by the worldwide building sectors (Gong & Song, 2015). After examining additionally 650 life cycle evaluations of GHGs it is found that as long as a building lasts it emits a maximum rate of GHGs which are mostly responsible for climate change (Röck et al., 2020). The result of the increasing GHGs record an alarming rate of global warming in the last decades. The temperature of the earth becomes warmer day by day. The average rising in global temperature was only 0.290C in 1981-1990 but it reached 0.820C in 2011-2020 (Roston, 2021). It is predicted that global warming can reach an alarming rate by 2050 (Lebling et al., 2020). Due to global warming, the environmental ecosystem is getting very damaged in recent years (Biswas et al., 2016). There are some adverse effects of global warming in the environment such as it rapidly declines the groundwater level (Islam & Biswas, 2020), it decreases the plankton density in marine ecosystems as well as oxygen-producing rate by warming seawater (Mandal et al., 2020), it also becomes a threat for the living beings near coastal areas introducing natural destructive phenomena (Mandal et al., 2021). Furthermore, cities can become 40C hotter by 2100 than rural areas (Zhao et al., 2021). Day to day the temperature of cities becomes high not only for industrialization and population density but also for unplanned construction. So, it is necessary to take a look at building construction technologies not only to cut GHGs but also to save cities. There exists a lot of techniques to reduce GHG emissions from buildings (Pacala & Socolow, 2004). To minimize the level of GHG emissions, carbon-reducing techniques and renewable energy segments need to develop (Pal, 2017). The expansions of renewable energy strategies like bioenergy potential (Smeets et al., 2007), geothermal energies (Pollack et al., 1993), solar, hydro, ocean, wind hybrid sectors (Rezaie et al., 2011) can boost the energy-saving techniques of building. Generally, the application of renewable energies without using fossil fuels is called zero carbon emission building (Kaygusuz, 2007). Moreover, to lessen the energy consumption the residential apartments can be decorated in a north-south oriented configuration, but if it is not possible then the solar chimney will be a good alternative (Rahbarianyazd & Raswol, 2018). It also needs to keep in mind that, buildings need to be environmentally friendly, technically attractive and possibly cost effective (Rezaie et al., 2011). Adopting the “Smart Cities Plan” with green infrastructure will be a standard solution (Zhao et al., 2021). It is also remarked that cities are mostly influenced by the impact of globalization since cities are the main ruler of any country (Kara, 2019). But sustainable smart city planning is a pleasant and environment-saving policy with high-quality life and economy (Sasanpour, 2017). The green infrastructure can become an effective tool for industrialization without harming the natural elements (Reza et al., 2017). An experimental comparison of sustainable green infrastructure is demonstrated for different environmental products of building regions (Nyári, 2011). Generally, green infrastructure indicates green buildings, which is a good initiative to make sustainable construction for smart cities (Shawkat et al., 2018). Green building is an ecological indicator against all kinds of toxic emissions (Liu & Lin, 2016). Each part of a green building is made to fight against all kinds of ecological obesity. Green building is quite helpful to reduce 20% of building-related GHGs emissions (Nyári, 2011). Green buildings can reduce about 30%-40% of energy consumption, lessen about 33% of global GHG emissions, reduce 30% of water consumption, reduce 50% of solid waste, provide better indoor air quality, etc (Reddy, 2016). In green buildings, the indoor temperature quality can be improved by the buildings green roof impact (Jaffal et al., 2012). The United States Green Building Council (USGBC) works for all possible countries to make people concern about the sustainability of the earth for fighting against GHG emissions, for example, the logical role of green buildings had statistically analysed almost all over India on behalf of GRIHA (Tathagat & Dod, 2015), China recently adopts green building technologies to reduce carbon emission (Wu et al., 2017), etc. Furthermore, many European and South Indian countries like Manila, India, New York, Mexico, Tokyo, Singapore, Jakarta, Beijing, etc. are adopted carbon footprint technologies for developing urban areas (Sovacool & Brown, 2010). Mathematical modelling is widely used to demonstrate various types of real-life problems to create a good prognosis, determination, arrangements and respiration mechanisms (Mondal et al., 2017). Any kind of interaction or affirmation relationships of species is perfected to explain by mathematical modelling. In mathematical modelling, we use the changing rate of any subject according to time, which is expressed in terms of differential equations. The differential equation shows the natural behaviour of the species to cope up with the environment ecosystem. There are a lot of dynamics of mathematical modelling, for example, the SIS epidemic model, the Logistic model, the Lotka-Volterra predator-prey model, the SEIR disease model, the SIR epidemic model, the optimal control strategic model, etc. Each of the models is used for describing the different-different state of environmental ecology. For example, the SIS model is used to describe the rate of natural births-deaths and disease-related deaths with time (Hethcote & van den Driessche, 1995), the SIR model is used to discuss the spread of epidemiology (Parvin et al., 2020), the Lotka-Volterra model describes the ecological dynamics of the interaction of the species where one is prey and the other one is a predator (Zhu & Yin, 2009), the optimal control strategic model generally discusses the control dynamics of any kinds of an outbreak (Shanta & Biswas, 2020), the Logistic-Model is used to describe the carrying capacity of any species in the environment (Marchetti et al., 1996), etc.
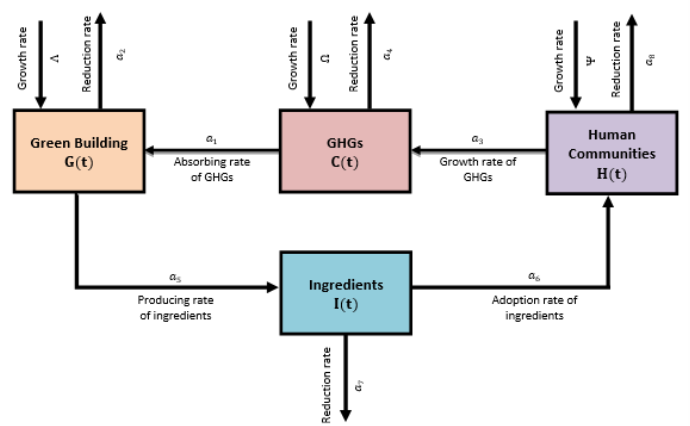
The study deals with green building technologies and the emission of GHGs by human communities and their correlations. The study is aimed to discuss the impact of green building by absorbing GHG for human communities. We have proposed a mathematical model which contains a set of non-linear ordinary differential equations to make the GHG components beneficial by integrating them into green building technologies. The model is analytically analysed first and then numerical simulations are performed. At each equilibrium point, the stability analysis has been observed with the state variables positivity test. The analytical result is examined with the help of numerical discussion to approve the model.
2. Material and Methods
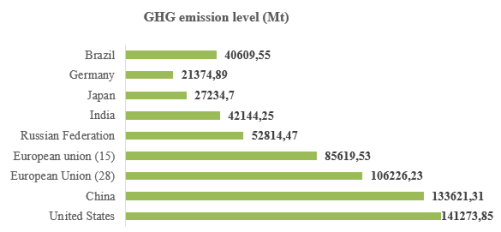
We are living in such a present world that is fully organized with developed artistic creation, where civilization means highly performed techniques and technologies in every part of daily necessities. To cope up with this modern era we have forgotten about the limitation of natural eco-balance unfortunately. This results in a curse that, 2020 is addressed as the warmest year on record (Hausfather, 2020). It is a very expected result that the Arctic sea ice line is noticed at a record level low than before (Hausfather, 2020). Can we think for a while about our future era? If the global warming issues can’t be kept in control the earth will not remain worth for sustain. It is seriously high time to cut GHGs to save our future world. It is a great remark that the developed countries use their land not as much for forestation but much more for industrialization (Hanley, 2015). The World Resources Institute CAIT Climate Data Explorer has made a statistical overview on global GHG emissions shown in Figure 1. The United States and China are the top GHG emission countries. Figure 1 displays the total amount of GHG emissions for top GHG emitted countries in 1990-2012 (Hanley, 2015).
6. Conclusion
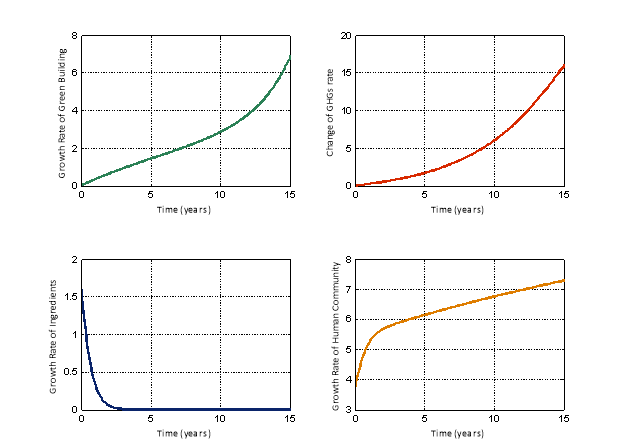
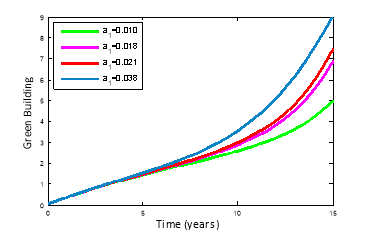
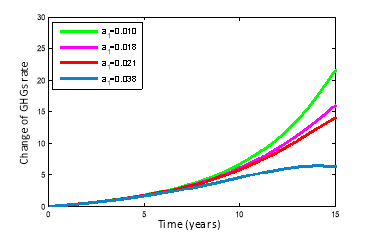
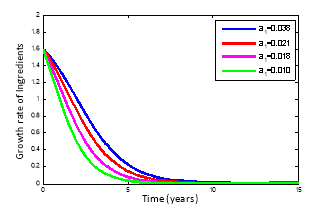
To analyse any kind of natural assumption both analytically and numerically, mathematical modelling is a well-recognized tool. To describe the impact of green building on rapid GHG emissions, a non-linear mathematical model has been proposed in this study. The model is developed considering the effects of green buildings on human communities and GHGs absorption. After formulating the mathematical model is verified by the positivity analysis to confirm the existence of the considered state variables. Furthermore, the stability analysis is performed for both global and trivial equilibrium states. To verify and describe the accuracy of the analytical results of this study, numerical simulations are carried on. Overall, the results of this study conclude with the following points:
-
Global warming is increasing at an alarming rate due to the extreme emission of GHGs.
-
Different human activities especially building technologies are responsible for extreme GHGs emissions. As a result, the earth’s climate, as well as atmospheric temperature, are rapidly changing.
-
The amount of GHGs is proportionally decreased with the increasing green buildings.
-
The production of ingredients and the absorption of GHGs proportionally depend on the number of green buildings.
-
Green buildings can enhance the ingredients and human communities by absorbing more GHGs.
If the cyclic process of GHGs absorption is continued by introducing the technology of green buildings, the dream of future sustainable cities will no longer remain in only imagination. The green building is quite enough warrior to fight against the excess concentration of GHGs. Therefore, it is time to protect the world from global warming by controlling extreme emissions of GHGs and adopting green buildings as much as possible.
Acknowledgement
This research did not receive any specific grant from funding agencies in the public, commercial, or not-for-profit sectors.
Conflict of interests
The authors declare no conflict of interest.
References
Biswas, M. H. A., Hossain, M. R., & Mondal, M. K. (2017). Mathematical modelling applied to sustainable management of marine resources. Procedia Engineering, 194, 337-334.
https://doi.org/10.1016/j.proeng.2017.08.154
Biswas, H. A., Rahman, T., & Haque, N. (2016). Modeling the potential impacts of global climate change in Bangladesh: an optimal control approach. Journal of Fundamental and Applied Sciences, 8(1), 1-19. https://doi.org/10.4314/jfas.v8i1.1
Broom, D., & Gray, A. (2020). The US is set to rejoin the Paris climate agreement. Here’s what you need to know. Regional Agenda: Environment and Natural Resource Security, Climate Change, GreenHorizon2020. World Economic Forum. Retrieved from:. https://www.weforum.org/agenda/2020/11/paris-agreement-climate-change-us-biden/
Edenhofer, O. R., Pichs-Madruga, R., Sokona, Y., Farahani, E., Kadner, S., Seyboth, K., Adler, A., Baum, I., Brunner, S., Eickemeier, P., Kriemann, B., Savolainen, J., Schlomer, S., Stechow, Z. V., Zwickel, T., & Minx, J. C. (2014). Climate Change 2014: Mitigation of Climate Change. Working Group III Contribution to the Fifth Assessment Report of the Intergovernmental Panel on Climate Change. Cambridge University Press, Cambridge, United Kingdom and New York, USA. https://www.ipcc.ch/site/assets/uploads/2018/02/ipcc_wg3_ar5_full.pdf
Gong, Y., & Song, D. (2015). Life Cycle Building Carbon Emissions Assessment and Driving Factors Decomposition Analysis Based on LMDI—A Case Study of Wuhan City in China. Sustainability, 7(12). https://doi.org/10.3390/su71215838
Grant, M., Pitt, H., & Larsen, K. (2021). Preliminary 2020 Greenhouse Gas Emissions Estimates for China. Rhodium Group, New York.
Gul, M. S., & Patidar, S. (2015). Understanding the energy consumption and occupancy of a multi-purpose academic building. Energy and Buildings, 87, 155-165. https://doi.org/10.1016/j.enbuild.2014.11.027
Hanley, M. (2015). Which countries emit the most greenhouse gas? Global Agenda: Environment and Natural Resource Security, Global Governance, World Economic Forum. https://www.weforum.org/agenda/2015/07/countries-emitting-most-greenhouse-gas/
Hausfather, Z. (2020). 2020 is on course to be the warmest year on record. Global Agenda: Environment and Natural Resource Security, Decarbonizing Energy, World Economic Forum.
Hethcote, H. W., & van den Driessche, P. (1995). An SIS epidemic model with variable population size and a delay. Journal of Mathematical Biology, 34, 177-194. https://doi.org/10.1007/BF00178772
Islam, A., & Biswas, M. H. A. (2020). Modeling the Effect of Global Warming on the Sustainable Groundwater Management: A Case Study in Bangladesh WSEAS TRANSACTIONS on MATHEMATICS, 19, 639-646. https://doi.org/10.37394/23206.2020.19.71
Jaffal, I., Ouldboukhitine, S.-E., & Belarbi, R. (2012). A comprehensive study of the impact of green roofs on building energy performance. Renewable Energy, 43, 157-164. https://doi.org/10.1016/j.renene.2011.12.004
Kara, B. (2019). The impact of globalization on cities. Journal of Contemporary Urban Affairs, 3(2), 108-113. https://doi.org/10.25034/ijcua.2018.4707
Kaygusuz, K. (2007). Energy for Sustainable Development: Key Issues and Challenges. Energy Sources, Part B: Economics, Planning, and Policy, 2(1), 73-83. https://doi.org/10.1080/15567240500402560
Larsen, K., Pitt, H., Grant, M., & Houser, T. (2021). China’s Greenhouse Gas Emissions Exceeded the Developed World for the First Time in 2019. Rhodium Group, New York. https://rhg.com/research/chinas-emissions-surpass-developed-countries/
Lebling, K., Friedrich, J., & Waite, R. (2020). Climate action must progress far faster to achieve 1.5°C goal. Global Agenda: Environment and Natural Resource Security, Green New Deals, World Economic Forum. https://www.weforum.org/agenda/2020/11/climate-action-emissions-target-paris-agreement
Liu, H., & Lin, B. (2016). Ecological indicators for green building construction. Ecological Indicators, 67, 68-77. https://doi.org/10.1016/j.ecolind.2016.02.024
Mandal, S., Islam, M. S., & Biswas, M. H. A. (2020). Modeling the Impact of Carbon Dioxide on Marine Plankton. INTERNATIONAL JOURNAL OF MATHEMATICS AND COMPUTERS IN SIMULATION, 14, 197-202. https://doi.org/10.46300/9102.2020.14.25
Mandal, S., Islam, M. S., & Biswas, M. H. A. (2021). Modeling the potential impact of climate change on living beings near coastal areas. Modeling Earth Systems and Environment, 7(3), 1783-1796. https://doi.org/10.1007/s40808-020-00897-5
Marchetti, C., Meyer, P. S., & Ausubel, J. H. (1996). Human population dynamics revisited with the logistic model: How much can be modeled and predicted? Technological Forecasting and Social Change, 52(1), 1-30. https://doi.org/10.1016/0040-1625(96)00001-7
Mardiana, A., & Riffat, S. B. (2013). Review on physical and performance parameters of heat recovery systems for building applications. Renewable and Sustainable Energy Reviews, 28, 174-190. https://doi.org/10.1016/j.rser.2013.07.016
Metz, B., Davidson, O., Bosch, P., Dave, R., & Meyer, L. (2007). Climate Change 2007: Mitigation of Climate Change. Cambridge University Press, Cambridge, United Kingdom and New York, NY, USA. https://www.ipcc.ch/site/assets/uploads/2018/03/ar4_wg3_full_report-1.pdf
Mondal, M. K., Hanif, M., & Biswas, M. H. A. (2017). A mathematical analysis for controlling the spread of Nipah virus infection. International Journal of Modelling and Simulation, 37(3), 185-197. https://doi.org/10.1080/02286203.2017.1320820
Nyári, J. (2011). Carbon footprint of construction products: a comparison of application of individual Environmental Product Declarations and Building Information Modeling software. https://www.theseus.fi/handle/10024/93737
Pacala, S., & Socolow, R. (2004). Stabilization Wedges: Solving the Climate Problem for the Next 50 Years with Current Technologies. Science, 305(5686), 968-972. https://doi.org/10.1126/science.1100103
Pal, S. K. D. (2017). Feasibility of a Carbon Consumption Tax for sustainable development–A case study of India. Journal of Contemporary Urban Affairs, 1(3), 18-23. https://doi.org/10.25034/ijcua.2018.3674
Parvin, T., Islam, A., Mondal, P. K., & Biswas, M. H. A. (2020). Discrete Type SIR Epidemic Model with Nonlinear Incidence Rate in Presence of Immunity. WSEAS TRANSACTIONS on BIOLOGY and BIOMEDICINE, 17, 104-118. https://doi.org/10.37394/23208.2020.17.13
Pollack, H. N., Hurter, S. J., & Johnson, J. R. (1993). Heat flow from the Earth's interior: analysis of the global data set. Reviews of Geophysics, 31(3), 267-280. https://doi.org/10.1029/93RG01249
Rahbarianyazd, R., & Raswol, L. (2018). Evaluating energy consumption in terms of climatic factors: A case study of Karakol residential apartments, Famagusta, North Cyprus. Journal of Contemporary Urban Affairs, 2(1), 45-54. https://doi.org/10.25034/ijcua.2018.3658
Reddy, S. (2016). The environmental benefits of building green-an overview. International Journal of Engineering and Management Research (IJEMR), 6(6), 109-113.
Reza, A. K., Islam, M. S., & Shimu, A. A. (2017). Green Industry in Bangladesh: An Overview. Environmental Management and Sustainable Development, 6(2), 124-143. https://doi.org/10.5296/emsd.v6i2.11027
Rezaie, B., Esmailzadeh, E., & Dincer, I. (2011). Renewable energy options for buildings: Case studies. Energy and Buildings, 43(1), 56-65. https://doi.org/10.1016/j.enbuild.2010.08.013
Röck, M., Saade, M. R. M., Balouktsi, M., Rasmussen, F. N., Birgisdottir, H., Frischknecht, R., Habert, G., Lützkendorf, T., & Passer, A. (2020). Embodied GHG emissions of buildings – The hidden challenge for effective climate change mitigation. Applied Energy, 258(114107), 1–12. https://doi.org/10.1016/j.apenergy.2019.114107
Roper, W. (2021). This chart shows how global temperatures have risen since 1950. Global Agenda: Climate indicators, How to save the planet, World Economic Forum. https://www.weforum.org/agenda/2021/01/climate-change-global-warming-carbon-dioxide-emissions-science/
Roston, E. (2021). 2020 Ties for Hottest Year in the Hottest Decade Ever. Climate Adaptation, Bloomberg Green.
Sasanpour, F. (2017). Livable city one step towards sustainable development. Journal of Contemporary Urban Affairs, 1(3), 13-17. https://doi.org/10.25034/ijcua.2018.3673
Shanta, S. S., & Biswas, M. H. A. (2020). The impact of media awareness in controlling the spread of infectious diseases in terms of SIR model. Mathematical Modelling of Engineering Problems, 7(3), 368-376. https://doi.org/10.18280/mmep.070306
Shawkat, L. W., Al-Din, S. S. M., & Kuzović, D. (2018). Opportunities for Practicing Sustainable Building Construction in Kurdistan Region, Iraq. Journal of Contemporary Urban Affairs, 2(1), 69-101. https://doi.org/10.25034/ijcua.2018.3665
Smeets, E. M. W., Faaij, A. P. C., Lewandowski, I. M., & Turkenburg, W. C. (2007). A bottom-up assessment and review of global bio-energy potentials to 2050. Progress in Energy and Combustion Science, 33(1), 56-106. https://doi.org/10.1016/j.pecs.2006.08.001
Sovacool, B. K., & Brown, M. A. (2010). Twelve metropolitan carbon footprints: A preliminary comparative global assessment. Energy Policy, 38(9), 4856-4869. https://doi.org/10.1016/j.enpol.2009.10.001
Tathagat, D., & Dod, R. D. (2015). Role of green buildings in sustainable construction-need, challenges and scope in the Indian scenario. IOSR Journal of Mechanical and Civil Engineering (IOSR-JMCE) 12(2), 01-09.
Wang, S., Fang, C., Guan, X., Pang, B., & Ma, H. (2014). Urbanisation, energy consumption, and carbon dioxide emissions in China: A panel data analysis of China’s provinces. Applied Energy, 136, 738-749. https://doi.org/10.1016/j.apenergy.2014.09.059
Wu, X., Peng, B., & Lin, B. (2017). A dynamic life cycle carbon emission assessment on green and non-green buildings in China. Energy and Buildings, 149, 272-281. https://doi.org/10.1016/j.enbuild.2017.05.041
Yau, Y. H., & Hasbi, S. (2013). A review of climate change impacts on commercial buildings and their technical services in the tropics. Renewable and Sustainable Energy Reviews, 18, 430-441. https://doi.org/10.1016/j.rser.2012.10.035
Yilmaz, D. G. (2021). Model Cities for Resilience: Climate-led Initiatives. Journal of Contemporary Urban Affairs, 5(1), 47-58. https://doi.org/10.25034/ijcua.2021.v5n1-4
Zhao, L., Oleson, K., Bou-Zeid, E., Krayenhoff, E. S., Bray, A., Zhu, Q., Zheng, Z., Chen, C., & Oppenheimer, M. (2021). Global multi-model projections of local urban climates. Nature Climate Change, 11, 152-157. https://doi.org/10.1038/s41558-020-00958-8
Zhu, C., & Yin, G. (2009). On competitive Lotka–Volterra model in random environments. Journal of Mathematical Analysis and Applications, 357(1), 154-170. https://doi.org/10.1016/j.jmaa.2009.03.066