Dechaicha, A., Daikh, A. & Alkama, D. (2021). Monitoring and Landscape Quantification of Uncontrolled Urbanisation in Oasis Regions: The Case of Adrar City in Algeria. Journal of Contemporary Urban Affairs, 5(2), 209-219. https://doi.org/10.25034/ijcua.2021.v5n2-5
|

|
Journal of Contemporary Urban Affairs
|
|
2021, Volume 5, Number 2, pages 209– 219
Monitoring and Landscape Quantification of Uncontrolled Urbanisation in Oasis Regions: The Case of Adrar City in Algeria
* 1 Dr. Assoule Dechaicha   , 2 Assist. Prof. Adel Daikh , 3 Prof. Dr. Djamel Alkama , 2 Assist. Prof. Adel Daikh , 3 Prof. Dr. Djamel Alkama
1, 2 and 3 Department of Architecture, Faculty of Sciences and Technology, 8 May 1945 University, Guelma, Algeria
E-mail 2: dechaicha.assoul@univ-guelma.dz , E-mail 1: alkama.djamel@univ-guelma.dz
E-mail 3: daikh.adel@univ-guelma.dz
|
|
ARTICLE INFO:
Received 20 March 2021
Accepted 25 July 2021
Available online 12 August 2021
Keywords:
Uncontrolled Urbanisation,
Satellite Images,
Landscape Metrics,
Palm groves,
Oasis Ecosystem.
|
ABSTRACT 
Nowadays, uncontrolled urbanisation is one of the major problems facing Algerian oasis regions. The monitoring and evaluation of its landscape transformations remain a key step for any oasis sustainability project. This study highlights the evolution of spatial growth in the city of Adrar in southern Algeria during the period 1986-2016 by establishing a Spatio-temporal mapping and landscape quantification. The methodological approach is based on a multi-temporal analysis of Landsat satellite images for 1986, 1996, 2006 and 2016, and the application of landscape metrics. The results show two opposite spatial trends: significant growth of built-up areas against an excessive loss of palm groves. The landscape metrics allowed the identification of a progressive fragmentation process characterising the palm groves. Thus, the findings of this study show the utility of satellite imagery and landscape metrics approach for monitoring urbanisation patterns and assessing their impacts on oasis ecosystems.
|
|
|
|
|
|
JOURNAL OF CONTEMPORARY URBAN AFFAIRS (2021), 5(2), 209-219.
https://doi.org/10.25034/ijcua.2021.v5n2-5
www.ijcua.com
Copyright © Dr. Assoule Dechaicha, Assist. Prof. Adel Daikh, Prof. Dr. Djamel Alkama.
|
|
|
|
1. Introduction
Uncontrolled urbanisation is currently a major challenge for spatial planners and developers, given its irreversible effects on the biosphere at different scales. On a global level, cities contribute to the aggravation of problems related to Greenhouse gas emissions, pollution, climate change and the depletion of natural resources. At the local level, the rapid urbanisation of territories is considered responsible for the degradation of agricultural land and local biodiversity as well as problems related to socio-spatial segregation (Elmqvist et al., 2013; UN, 2018). This galloping urbanisation is more accentuated in developing countries, but with less mastery of spatial planning (Cohen, 2006; Güneralp et al., 2017). The arid regions of southern Algeria have not escaped this universal phenomenon, and the consequences are more marked because of the fragility of their ecosystems. (Côte, 2012; Dechaicha & Alkama, 2020a).
The spatial translation of this urban growth is a rather disproportionate sprawl of the urban perimeters of the Algerian Sahara cities. Urban areas are constantly increasing their surface area, harming environmental potential, thereby altering the oasis landscape and endangering its ecosystem. The oasis, based since its origin on the ecosystem trilogy of water, habitat and palm grove, has undergone a morphological and functional upheaval due to uncontrolled urbanisation (Dechaicha & Alkama, 2020a; Dechaicha & Alkama, 2020b; Kouzmine, 2012).
However, this accelerated growth is less estimated in the urban master plans and development projects. Until today, local authorities do not have appropriate tools to control and manage the sprawl of oasis cities (CNES, 2002; Sidi Boumedine, 2013). The recent advent of remote sensing has raised the expectations of urban planners and other city actors. Satellite images allow the observation of terrestrial phenomena, objects and provide more reliable spatial information of regular temporality. Satellite images are currently a relatively important source of information because of the nature and quality of the data they carry (Ban, 2016).
This study aims to map and assess the spatial growth of a large oasis city, Adrar, through a quantitative approach based on the use of multi-date satellite images and the application of landscape metrics. The paper is structured in four sections. Section 1 presents the conceptual elements related to satellite imagery and landscape metrics. Section 2 presents the study area and the methodology adopted. The results obtained and their interpretation is presented in Section 3. Section 4 concludes the paper and highlights some perspectives for future work.
1.1 Remote Sensing to Monitor and Map Uncontrolled Urbanisation
Remote sensing is the system of acquiring biophysical information about land areas from a distance. It includes the process of detecting, recording and analysing the data obtained. Through multiband images provided by satellite sensors, this technology facilitates the monitoring and understanding of terrestrial processes. A satellite image is a digital representation of the earth's reality, captured and recorded by a satellite sensor (Tempfli et al., 2004). Since the first generations of civilian satellite sensors were put into orbit in the early 1970s, satellite images have played an important role in studying terrestrial phenomena. Satellite images provide several opportunities. On the one hand, they offer data-rich in spatial information, covering large geographical areas, regularly updated, easily accessible, and lower economic costs. On the other hand, the digital nature of satellite images makes them suitable for integration into Geographic Information Systems (GIS). Indeed, satellite imagery has become an essential tool for studying Spatio-temporal dynamics occurring on land territories such as urban sprawl (Ban, 2016; Kadhim et al., 2016; Netzband et al., 2007).
1.2 Application of Landscape Metrics to Quantify and Assess Urbanisation Patterns
In urban landscape ecology, the city is spatially considered a complex landscape consisting of diverse fragments interfered with according to anthropic and natural logics (Wu et al., 2013). The evaluation of the spatial growth impacts of cities uses landscape metrics developed within Landscape Ecology during the 1980s. These metrics, also called spatial metrics, are used to describe landscape structures through the measurement of certain properties characterising their composition and spatial configuration. Composition corresponds to the diversity and abundance of elements constituting the landscape; configuration concerns the shape, size and spatial arrangement of these compositional elements. Three scales of study can be considered: the patch level, the class level and the landscape level (McGarigal et al., 2012). Numerous studies have shown the importance of these metrics to describe cities’ growth process and assess its impact on the environment (Herold et al., 2005; Liu & Yang, 2015).
2. Material and Methods
2.1 Study area
The city of Adrar is located 1400 km south of the capital Algiers (Figure 1). It is the capital of a large district and the capital of the historic oasis region of Touat in southwest Algeria. Geographically, this oasis is situated at latitude 27° 52' N, longitude 0° 17' W, and altitude 258 m. Climatically, this region belongs to the hyper-arid climate, characterised by dry and hot summers and relatively cold and mild winters, particularly during the night. The dry period occupies most of the year, with a period from April to November. Average temperatures vary between a maximum of 45.2°C (July) and a minimum of 5.8°C (January). The average relative humidity varies between 39.6% (December) and 12.10% (July). Precipitations are rare, with an annual total of around 11 mm, falling mainly in autumn and spring. On the other hand, solar irradiation is very high in this region, with an estimated average sunshine duration of 3 978 hours/year.
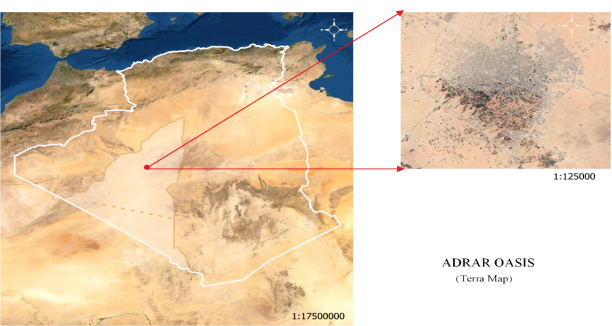
Figure 1. The study area (Source: Authors, based on Terra Map images)
This city has experienced significant population growth, particularly following its promotion to the status of district chief city. The population has grown from 4,468 inhabitants in 1966 to 85,650 in 2016 (a more than 19-fold increase). Spatially, this demographic boom has resulted in an excessive spread of built-up areas. Numerous problems currently persist, such as the uncontrolled consumption of space according to development models less adapted to local bioclimatic and landscape specificities (Maachou et al., 2018; Trache, 2011).
2.2 Data and materials
This study aims to characterise the urban area evolution of Adrar City over 30 years, between 1986 and 2016. A period during which urban sprawl seems to be more significant. A sequential series of four Landsat multispectral images were acquired via the USGS (United States Geological Survey). The images acquired correspond to the following years: 1986, 1996, 2006 and 2016. These four satellite images were selected for their temporal similarities (scenes taken in the same seasons of the year and with very close daylight hours) to ensure a better similarity in atmospheric and phenological conditions. Table 1 lists the characteristics of the images obtained.
Table 1. Characteristics of the Landsat images used
|
Image
|
Sensor
|
Date
|
Bands
|
Cloud cover
|
Spatial resolution (m)
|
|
Image 1
|
Landsat 5 TM
|
15-04-1986
|
1-2-3-4-5-7
|
0
|
30
|
|
Image 2
|
Landsat 5 TM
|
26-04-1996
|
1-2-3-4-5-7
|
0
|
30
|
|
Image 3
|
Landsat 5 TM
|
22-04-2006
|
1-2-3-4-5-7
|
0
|
30
|
|
Image 4
|
Landsat 8 OLI-TIRS
|
17-04-2016
|
2-3-4-5-6-7
|
0
|
30
|
Auxiliary maps were used as reference documents. These are three plot plans from 1988, 2006 and 2015, an aerial photo taken in 2006 and four Geotif images in natural colouring supplied by the USGS, corresponding to 1986, 1996, 2006 and 2016, respectively. The classification and post-classification process of the satellite images was carried out using QGIS software. The calculation of landscape metrics was carried out using FRAGSTAT software (McGarigal et al., 2012).
2.3 Methodological approach
The analysis process is structured in four steps: pre-processing and normalisation of the acquired images, classification and refinement of the classification, validation of the classification, and calculation of landscape metrics (Ban & Yousif, 2016; Herold et al., 2005).
2.3.1 Image pre-processing and normalisation
The images selected for this study are L1TP. This category of images is geometrically self-correcting and geocoded before released by the USGS, according to the WGS 84 geographic referencing system, zone 31 North. The study area was extracted through a cutting window, including the current urban perimeter and its immediate surroundings (longitude 0°20'08''W, 0°14'44''W and latitude 27°49'23''N, 27°54'26''N). Thus, a radiometric calibration, consisting of converting image radiance into reflectance, was performed by executing a TOA (Top of Atmospheric) correction and applying the DOS1(Dark Object Subtraction) model (Congedo, 2016; Gao et al., 2009; Tucker et al., 2004). Subsequently, an enhancement operation was applied to the images to improve their quality and facilitate their visual interpretation. A false colour composition was maintained (Figure 2), with the combination of bands (4-3-2) for the TM images and (5-4-3) for the Landsat OLI-TIRS image (Congedo, 2016).
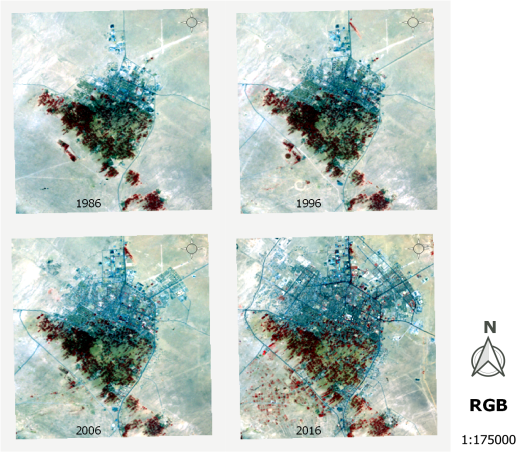
Figure 2. False-colour compositions of the images used (1986 - 1996 - 2006 - 2016).
(Source: Authors, based on USGS images)
2.3.2 Classification and refinement of the classification
The classification of satellite data is a widely used method for the extraction of spatial information. It consists of assigning to each pixel its land-use belonging. The supervised classification method is chosen for this study, considering the knowledge of the field and the documents available. Before proceeding with the classification of the images, four land use classes were defined according to the FAO nomenclature (2016):
1) Urbanised areas (built and developed areas);
2) Palm groves (phoeniculture);
3) Low vegetation (grasslands, market gardens and agricultural land);
4) Bare soil (undeveloped and uncultivated land).
The sampling of test areas was established by photo-interpretation of images in coloured compositions (Figure 2), corresponding to reference maps (Munafò & Congedo, 2017). Representative polygons of different classes were generated through the Region Growing algorithm. This sampling step was used to measure the spectral properties of each land-use class, from which the spectral classification of the set of images used was made (Congedo, 2016).
The maximum likelihood classification (MLC) algorithm was used to perform the supervised classification (Lu & Weng, 2007; Mather & Tso, 2016; Phiri & Morgenroth, 2017). Subsequently, a post-processing enhancement of the maps generated by the classification was carried out. It consists of correcting the confusions induced by the classification and eliminating isolated pixels by applying a 3x3 pixel filter. At the end of this stage, a reclassification treatment was applied to the three maps to make them homogeneous and comparable (Lu & Weng, 2007). Regarding vegetation, two classes were again distinguished: urban vegetation in the current urban perimeter, which corresponds to the palm grove, and peri-urban vegetation beyond the built-up area. The latter class represents the new farms established on the outskirts of the city. This reclassification allowed us to visualise the Spatio-temporal evolution of the palm grove within the urban perimeter, separately from that on the periphery.
2.3.3 Validation of the classification
The evaluation of the classification is important to proceed to the thematic analysis. It provides information on the level of accuracy of the maps produced by the classification. There are several methods for evaluating classification. The most common is the confusion matrix (Congalton, 1991). A synthetic index derived from the confusion matrix is also used in the evaluation of accuracy. This is the Kappa (Khat) index. It is a quality indicator used to measure the performance of multiclass classification. For a Khat value greater than or equal to 0.8, the classification is statistically significant. If Khat varies between 0.4 and 0.8, the classification is of medium consideration (Congalton & Green, 2008; Landis & Koch, 1977). In this study, the accuracy assessment was carried out by digitising 200 control points, created and randomly distributed over the study area. The confusion matrix was generated after the GIS comparison matrix calculation.
2.3.4 Calculation of landscape metrics
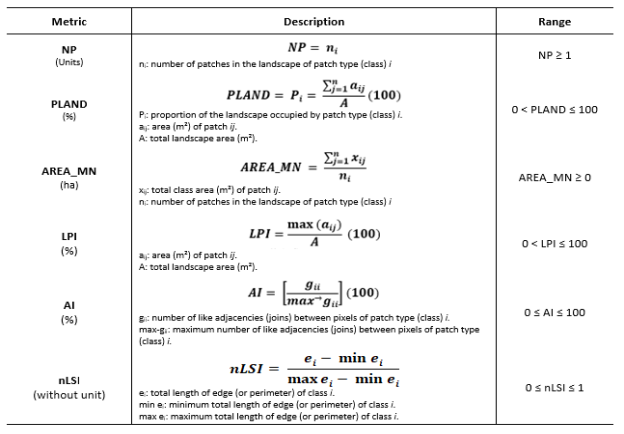
Since this is an assessment of the evolution of land use and land cover classes, the landscape metrics selected for the measurement of Spatio-temporal change correspond to the class metrics level. Six metrics were selected for this study (Herold et al., 2005; McGarigal et al., 2012):
- Number of Patches (NP): the calculation of the number of fragments constituting a given class makes it possible to determine the abundance or scarcity of compositional elements. The monitoring of this index allows us to see whether certain fragments appear or disappear, which reveals the Spatio-temporal trend (growth or decline).
- Percentage of Landscape (PLAND): this index refers to the surface percentage occupied by a land-use class. It is an index that can indicate dominance in the composition of the landscape.
- Mean patch size (AREA_MN): the mean area of patches belonging to the same class, measured in hectares (ha). Combining this index with the NP index makes it possible to describe the landscape evolution between aggregation and/or fragmentation. For built-up areas, it reveals the mode of spatial growth (by densification or fragmentation).
- Largest Patch Index (LPI): this shape index represents the portion occupied by the largest fragment for a given class. The calculation of this metric indicates the level of dominance of the largest fragments of the different classes. If LPI is close to 0, it means that the largest fragment of the class in question is minimal in the constitution of the landscape. On the other hand, if LPI = 100, this fragment occupies the whole landscape. An increase in the value of this index means that the dismayed class tends to dominate the landscape.
- Aggregation Index (AI): this is a synthetic configuration index describing the organisation and arrangement of the fragments of a given land-use class. The measurement of this index reveals the level of compactness (aggregation) or isolation of the fragments composing a landscape class. The value of AI varies between 0 and 100%. As AI tends to increase, the class concerned tends to become more compact and vice versa.
- Normalized Landscape Shape Index (nLSI): this index corresponds to the total edges (m) ratio between fragments to the total landscape area. The landscape’s compactness (or otherwise the disaggregation of fragments) can be assessed with this index and its geometric complexity. The value of nLSI varies between 0 and 1. nLSI = 0, which means that the landscape is perfectly compact (it is a square shape). Increasing the value of nLSI implies a decrease in the aggregation (or compactness) of the landscape and its shape becomes more complex, i.e., the edges become more elongated. Table 2 provides the equations for calculating these parameters and a description of their ranges.
Using the thematic maps from the satellite image classification as input, the calculation of these metrics was carried out using the free software FRAGSTAT. As for evaluating the results and considering the complexity of the studied landscapes, we proceeded to a correlation of these metrics to develop a synthetic interpretation considering the whole behaviour of the different metrics examined.
3. Results and Discussion
3.1 Validation of the classification
Four thematic maps were generated as a result of the classification (Figure 3). These maps correspond to the years 1986, 1996, 2006 and 2016, respectively. The calculation of the confusion matrices shows a satisfactory level of accuracy, both for the overall accuracy (98.20, 92.60, 91.34 and 94.16, respectively) and for the Khat index, for which the accuracy values obtained are 0.84, 0.90, 0.94 and 0.92 respectively (Table 3).
Table 3. Classification accuracy of the four images 1986, 1996, 2006 and 2016.
|
Type of assessment
|
1986
|
1996
|
2006
|
2016
|
|
Overall accuracy (%)
|
89.20
|
92.60
|
91.34
|
94.16
|
|
Accuracy of "urbanised area" class (%)
|
90.62
|
94.48
|
94.96
|
97.12
|
|
Accuracy of the "palm grove" class (%)
|
98.54
|
98.21
|
100.00
|
92.82
|
|
Khat index
|
0.84
|
0.90
|
0.94
|
0.92
|
3.2 The Spatio-temporal mapping change: a clear spread of built-up areas against an excessive retreat of the palm grove
The supervised classification resulted in four thematic maps, which are illustrated in Figure 3. The diachronic reading of these maps reveals a clear growth of the built-up areas along the study period, against an equally remarkable decline of the palm grove. Different spatial growth patterns can be distinguished between the different study periods.
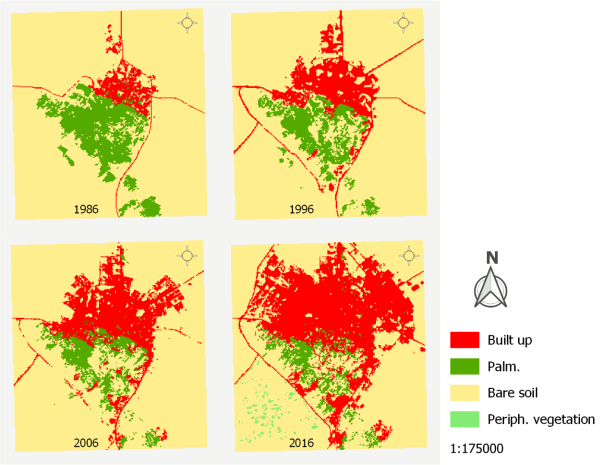
Figure 3. Spatio-temporal LUC evolution between 1986 and 2016.
During the first period (1986 - 1996), the spatial growth of the city of Adrar was characterised by a continuous mode with the existing fabric, especially towards the west (new city of Sidi Mohamed Belekbir), and towards the north along the national road RN° 6. The palm grove plots in contact with the urban fabric started to disappear after their conversion into built-up areas. During the second period (1996 - 2006), the city’s evolution is dominated by two spatial trends. On the one hand, there is a densification of the western part of the city in the same logic as the previous period. On the other hand, there is a stretching of the urban area towards the north-east (new city of Tililane) and the south (along the road to Tamentite). As a result of this last extension, the palm grove is affected, especially in its western part, where the penetration of urban extensions is observed. A city’s sprawl in all directions characterises the last study period (2006 - 2016).
The two new cities (Belekbir in the west and Tililane in the north) continued to receive new extensions through densification, as did the neighbourhoods along the Tamentite road. The quarters of this south-eastern strip (Ouled Ahmed Timmi quarters) have practically filled the interstitial pockets of the palm grove in its eastern part. Urban fragments appeared and spread along the southern edge of the same palm grove. At the end of this period, the uncontrolled urban extensions within the palm grove form continuous patches linking the three northern, southern and eastern sides, thus indicating a practically completed crossing of the green oasis network. Table 4 summarises the quantitative results obtained from the space-time mapping. The results indicate a variation in the rate of growth between the three periods (1986 - 1996), (1996 - 2006) and (2006 - 2016).
Table 4. Evolution of Land Use and Land Cover classes by area.
|
Land use class
|
Area (ha)
|
1986 - 1996
|
1996 - 2006
|
2006 - 2016
|
|
1986
|
1996
|
2006
|
2016
|
(ha)
|
(ha)
|
(ha)
|
|
Urbanised area
|
324.72
|
811.89
|
1197.54
|
2264.04
|
+48.72
|
+38.57
|
+106.65
|
|
Palm grove
|
878.67
|
596.25
|
479.70
|
395.82
|
- 28.24
|
- 11.65
|
- 8.39
|
|
Peripheral vegetation
|
-
|
-
|
-
|
75.6
|
-
|
-
|
+75.6
|
|
Bare ground
|
5983.29
|
5778.63
|
5509.53
|
4450.95
|
-20.47
|
-26.91
|
-105,86
|
|
|
|
|
|
|
|
|
|
Over the entire study period, the built-up area class recorded a significant increase in surface area. Between 1986 and 1996, this class increased from 324.72 ha to 811.89 ha of land area, with an increase of 487.17 ha, i.e., an annual growth of about 48.72 ha/year. On the other hand, the palm grove underwent an opposite process. Its surface area decreased from 878.67 ha in 1986 to 596.25 ha in 1996, with a loss of 282.42 ha, i.e., 32.14 % of lost surface area and 28.24 ha of annual loss. Between 1996 and 2006, the urbanised areas continued to grow to reach a surface area of 1197.54 ha in 2006, with an estimated surface gain of 385.65 ha, i.e., an annual change of around 38.57 ha per year (compared with 48.72 ha/year recorded between 1986 and 1996). A slowdown in the rate of growth compared with the first period can be noted. In addition, the palm grove continued to lose surface area, recording 479.70 ha in 2006 with an overall loss of around 116.55 ha, i.e., an annual loss equal to 11.65 ha per year. Less loss of agricultural land is also noted compared to the period (1986 - 1996).
The last period (2006 - 2016) is characterised by a significant expansion of the built-up area class. This class gained an estimated total area of 1066.50 ha (compared to 487.17 ha during the first period and 385.65 ha during the second period). In 2016, the urbanised areas reached a value of 2264.04 ha of spatial coverage, i.e., estimated annual growth of 106.65 ha per year. The rate of spatial growth is more marked in this last period than in the previous ones. The palm grove continued to lose space in the same way. Its surface area decreased to 395.82 ha, with an overall loss of 83.88 ha, i.e., an estimated annual loss of 8.39 ha per year (compared to 28.24 ha/year between 1986 and 1996, and 11.65 ha/year between 1996 and 2006). The rate of area loss is thus lower than in previous periods.
3.3 Assessing landscape changes: two opposing spatial trends
Figure 4 illustrates the results of the landscape metrics. The analysis of the evolution of the oasis landscape with the landscape metrics revealed two opposite processes: a surface growth of the urban area characterised by a compactification (aggregation) trend, against a progressive fragmentation of the palm grove. Regarding the class of built-up areas, two behaviours of the landscape indices are noted. The two periods (1986 - 1996) and (2006 - 2016) recorded simultaneous increases in the NP (number of the patch), AREA_MN (mean patch size) and PLAND (percentage of landscape) indices. This indicates the appearance of new urban fragments in contiguity with existing fragments.
In contrast, the period (1996 - 2006) saw an increase in the NP and PLAND indices but a decrease in the mean area (AREA_MN). This decrease shows the appearance of new urban fragments, but away from the existing fragments (on the periphery). Thus, a discontinuous growth mode is implemented during this period. The continuous increase of the synthetic AI (Aggregation Index) correlated with the increase of the LPI (Largest Patch Index) and the simultaneous decrease of the nLSI (Normalised Landscape Shape Index) shows that a tendency towards compaction dominates the urban fabric. The urban patch tends to have more complex morphologies during its spatial spread. As for the palm grove, the number of NP fragments recorded a continuous increase but with a decrease in the AREA_MN and PLAND indices, which means a continuous perforation of this space. The LPI and AI indices also recorded continuous decreases in their values, highlighting a process of fragmentation (disaggregation) of this green frame. The nLSI index confirms this trend of decline, which is more amplified during the first period (1986 - 1996).
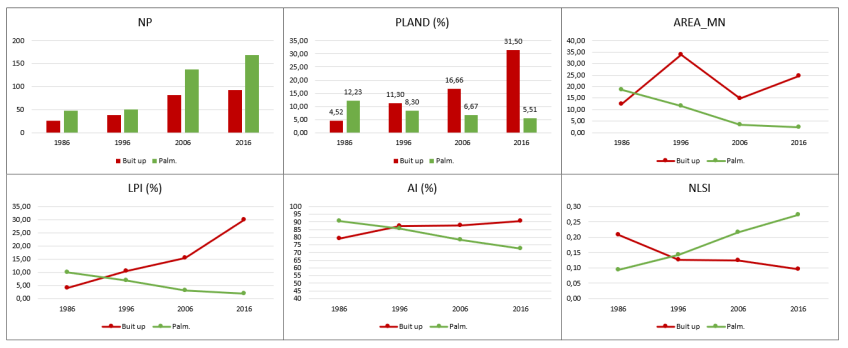
Figure 4. Evolution of landscape metrics characterising the city of Adrar (1986 – 2016).
4. Conclusion
Spatial and temporal mapping revealed two opposed spatial processes: the spread of the urban area versus the decline of the palm grove. Over the study period, the urban fabric grew considerably in area. This growth is mainly characterised by a continuous mode, with some discontinuous extensions along the Tamentit road to the south, especially during the period (1996 - 2006). The palm grove is progressively crossed by uncontrolled extensions of the built-up areas, starting with the edges’ nibbling and then invading the degraded areas inside. The quantification of the evolution of the land use classes has revealed variations in the rates of evolution: a rate of growth of the urbanised surfaces that were more accentuated during the last decade (2006 - 2016) and a rate of decrease of the palm grove that was more amplified during the first decade (1986 - 1996).
The combined monitoring of landscape metrics allowed us to highlight two opposite morphological trends: a trend towards the compactification of the built-up area class versus a trend towards the degradation and fragmentation of the palm grove space. The results of the landscape metrics combined with the Spatio-temporal cartographic analysis have allowed highlighting the negative impact of uncontrolled urban expansions on the palm grove. Between 1986 and 2016, the share occupied by urbanised areas increased from 4.52% to 31.50%, i.e., a sevenfold increase in 30 years. On the other hand, the palm grove decreased from 12.23% to 5.21%, i.e., a loss of more than 55%. Therefore, it is important to adopt approaches based on remote sensing and landscape metrics to control the rapid and uncontrolled urbanisation that is currently taking place in oasis cities and reduce its adverse effects on palm groves. Indeed, remote sensing and landscape metrics can be used as tools to help assess oasis management choices and make better decisions. Therefore, these tools offer the opportunity to formalise the best solutions and alternatives that meet the needs of protection and promotion of oasis environments.
Consequently, this study highlighted the importance of satellite imagery from remote sensing for monitoring and understanding the rapid and uncontrolled sprawl of urban and peri-urban areas and assessing its impacts on neighbouring ecosystems. This approach can be replicated in a broader perspective to study the phenomenon in other oasis cities and evaluate their urban development models. On a smaller scale, at the neighbourhood level, this approach can lead to the measurement and qualification of urban vegetation, a vital bioclimatic component to be highlighted for the sustainability of the Saharan city.
Acknowledgements
This research did not receive any specific grant from funding agencies in the public, commercial, or not-for-profit sectors.
Conflict of interests
The authors declare no conflict of interest.
References
Ban, Y. (2016). Multitemporal remote sensing: current status, trends and challenges. In Y. Ban (Ed.), Multitemporal Remote Sensing Methods and Applications (pp. 1-18). Springer. https://doi.org/10.1007/978-3-319-47037-5_1
Ban, Y., & Yousif, O. (2016). Change detection techniques: A review. In Multitemporal Remote Sensing Methods and Applications (pp. 19-43). Springer. https://doi.org/10.1007/978-3-319-47037-5_2
CNES. (2002). L’urbanisation et les risques naturels et industriels en Algérie : Inquiétudes actuelles et futures [Urbanisation and natural and industrial risks in Algeria: Current and future concerns]. S. r. CNES.
Cohen, B. (2006). Urbanization in developing countries: Current trends, future projections, and key challenges for sustainability. Technology in Society, 28(1), 63-80. https://doi.org/10.1016/j.techsoc.2005.10.005
Congalton, R. G. (1991). A review of assessing the accuracy of classifications of remotely sensed data. Remote Sensing of Environment, 37(1), 35-46. https://doi.org/10.1016/0034-4257(91)90048-B
Congalton, R. G., & Green, K. (2008). Assessing the accuracy of remotely sensed data: principles and practices. CRC press. https://doi.org/10.1201/9781420055139
Congedo, L. (2016). Semi-automatic classification plugin documentation. Release, 6(0.1). https://doi.org/10.13140/RG.2.2.29474.02242/1
Côte, M. (2012). Signatures sahariennes: terroirs & territoires vus du ciel [Saharan signatures: terroirs & territories seen from the sky]. AMU: Presses universitaires de Provence.
Dechaicha, A., & Alkama, D. (2020a). A spatio-temporal cartography and landscape metrics of urbanization patterns in algerian low-sahara. the case of ouargla city. Journal of Fundamental and Applied Sciences, 12(3), 1235-1252. https://wsjp.info/index.php/JFAS/article/view/840
Dechaicha, A., & Alkama, D. (2020b). DÉTECTION DU CHANGEMENT DE L’ÉTALEMENT URBAIN AU BAS-SAHARA ALGÉRIEN: APPORT DE LA TÉLÉDÉTECTION SPATIALE ET DES SIG. CAS DE LA VILLE DE BISKRA (ALGÉRIE) [Change Detection of urban sprawl in the Algerian Low-Sahara: contribution of spatial remote sensing and GIS. Case of the city of Biskra (Algeria)]. Revue Française de Photogrammétrie et de Télédétection RFPT(222), 43-51. https://doi.org/10.52638/rfpt.2020.486
Elmqvist, T., Fragkias, M., Goodness, J., Güneralp, B., Marcotullio, P. J., McDonald, R. I., Parnell, S., Schewenius, M., Sendstad, M., & Seto, K. C. (2013). Urbanization, biodiversity and ecosystem services: challenges and opportunities: a global assessment. Springer Nature. https://doi.org/10.1007/978-94-007-7088-1
Gao, F., Masek, J. G., & Wolfe, R. E. (2009). Automated registration and orthorectification package for Landsat and Landsat-like data processing. Journal of Applied Remote Sensing, 3(1), 033515. https://doi.org/10.1117/1.3104620
Güneralp, B., Lwasa, S., Masundire, H., Parnell, S., & Seto, K. C. (2017). Urbanization in Africa: challenges and opportunities for conservation. Environmental research letters, 13(1), 015002. https://doi.org/10.1088/1748-9326/aa94fe
Herold, M., Couclelis, H., & Clarke, K. C. (2005). The role of spatial metrics in the analysis and modeling of urban land use change. Computers, Environment and Urban Systems, 29(4), 369-399. https://doi.org/10.1016/j.compenvurbsys.2003.12.001
Kadhim, N., Mourshed, M., & Bray, M. (2016). Advances in remote sensing applications for urban sustainability. Euro-Mediterranean Journal for Environmental Integration, 1(1), 7. https://doi.org/10.1007/s41207-016-0007-4
Kouzmine, Y. (2012). Le Sahara algérien. Intégration nationale et développement régional [The Algerian Sahara. National integration and regional development]. Paris: L'Harmattan.
Landis, J. R., & Koch, G. G. (1977). The Measurement of Observer Agreement for Categorical Data. Biometrics, 33(1), 159-174. https://doi.org/10.2307/2529310
Liu, T., & Yang, X. (2015). Monitoring land changes in an urban area using satellite imagery, GIS and landscape metrics. Applied Geography, 56, 42-54. https://doi.org/10.1016/j.apgeog.2014.10.002
Lu, D., & Weng, Q. (2007). A survey of image classification methods and techniques for improving classification performance. International Journal of Remote Sensing, 28(5), 823-870. https://doi.org/10.1080/01431160600746456
Maachou, H. M., Belouadi, L., & Trache, S. M. (2018). Difficultés d’intégration d’un quartier spontané dans une ville saharienne: le cas de Bni Ouskout à Adrar [Difficulty of integrating an informal neighbourhood in a Saharian town: the case of Bni Ouskout in Adrar]. Les Cahiers d’EMAM(30). https://doi.org/10.4000/emam.1460
Mather, P., & Tso, B. (2016). Classification Methods for Remotely Sensed Data. CRC Press. https://doi.org/10.1201/9781420090741
McGarigal, K., Cushman, S. A., & Ene, E. (2012). FRAGSTATS v4: spatial pattern analysis program for categorical and continuous maps. Computer software program produced by the authors at the University of Massachusetts, Amherst.
Munafò, M., & Congedo, L. (2017). Measuring and monitoring land cover: Methodologies and data available. In C. Gardi (Ed.), Urban Expansion, Land Cover and Soil Ecosystem Services (pp. 19-32). London: Routledge. https://doi.org/10.4324/9781315715674-2
Neel, M. C., McGarigal, K., & Cushman, S. A. (2004). Behavior of class-level landscape metrics across gradients of class aggregation and area. Landscape Ecology, 19(4), 435-455. https://doi.org/10.1023/B:LAND.0000030521.19856.cb
Netzband, M., Stefanov, W. L., & Redman, C. (2007). Remote Sensing as a Tool for Urban Planning and Sustainability. In M. Netzband, W. L. Stefanov, & C. Redman (Eds.), Applied Remote Sensing for Urban Planning, Governance and Sustainability. Springer Berlin Heidelberg. https://doi.org/10.1007/978-3-540-68009-3_1
O'Neill, R. V., Krummel, J. R., Gardner, R. H., Sugihara, G., Jackson, B., DeAngelis, D. L., Milne, B. T., Turner, M. G., Zygmunt, B., Christensen, S. W., Dale, V. H., & Graham, R. L. (1988). Indices of landscape pattern. Landscape Ecology, 1(3), 153-162. https://doi.org/10.1007/BF00162741
Phiri, D., & Morgenroth, J. (2017). Developments in Landsat Land Cover Classification Methods: A Review. Remote Sensing, 9(9), 967. https://doi.org/10.3390/rs9090967
Sidi Boumedine, R. (2013). L’urbanisme en Algérie, échec des instruments ou instruments de l’échec [The Urbanism in Algeria, failure of instruments or instruments of failure]. Algiers: Les alternatives urbaines.
Tempfli, K., Kerle, N., Janssen, L. L. F., & Huurneman, G. C. (Eds.). (2004). Principles of remote sensing: an introductory textbook. ITC.
Trache, S. M. (2011). Adrar, des ksour à la grande ville Adrar [from ksour to town]. Insaniyat Revue Algérienne d’anthropologie et de Sciences Sociales(51-52), 149-163. https://doi.org/10.4000/insaniyat.12633
Tucker, C. J., Grant, D. M., & Dykstra, J. D. (2004). NASA’s global orthorectified Landsat data set. Photogrammetric Engineering & Remote Sensing, 70(3), 313-322. https://doi.org/10.14358/PERS.70.3.313
UN. (2018). The World’s Cities in 2018—Data Booklet. United Nations/ST/ESA/SER.A/417.
Wu, J., He, C., Huang, G., & Yu, D. (2013). Urban landscape ecology: Past, present, and future. In B. Fu & K. B. Jones (Eds.), Landscape ecology for sustainable environment and culture (pp. 37-53). Dordrecht: Springer Netherlands. https://doi.org/10.1007/978-94-007-6530-6_3
Dechaicha, A., Daikh, A. & Alkama, D. (2021). Monitoring and Landscape Quantification of Uncontrolled Urbanisation in Oasis Regions: The Case of Adrar City in Algeria. Journal of Contemporary Urban Affairs, 5(2), 209-219. https://doi.org/10.25034/ijcua.2021.v5n2-5
*Corresponding Author:
Department of Architecture, Faculty of Sciences and Technology, 8 May 1945 University, Guelma, Algeria
Email address: dechaicha.assoul@univ-guelma.dz
This article is an open access
article distributed under the terms and conditions of the Creative Commons Attribution (CC BY) license

This article is published with open access at www.ijcua.com