1. Introduction
The global concern about climate change has been increasing, since the emission of gases from human activities contributes to the greenhouse effect in the atmosphere, indicating significant impacts to the planet in the coming years. The changes have been associated with the issue of energy, especially renewable energies, which are directly linked to climate variations. According to Moraes (2013) in 1988, the Intergovernmental Panel on Climate Change (IPCC) was created through an initiative of the World Meteorological Organization (WMO) and the United Nations Environment Program (UNEP). The IPCC was established with the mission of evaluating research, interpreting it, and gathering all relevant information, both technical, scientific and socioeconomic, into comprehensive, easily understood and accessible reports by all in communities, including decision makers (Grimm , 2016; Moraes, 2013). According to Nimer (1989), rainfall occurred in Brazil’s southern region between 1990 and 2005 can be described as well distributed, with maxima ranging from 1200 to 2100 mm / year.
The hydroelectric plants are in the first position in the Brazilian energy matrix, evidencing, therefore, the need to know the distribution of the pluviometric regime of the region. The main objective of this work is to present an analysis of the impacts of climate change on rainfall in the Machadinho’s hydroelectric power plant region, which has an installed capacity of 1,140 MW and is located in the states of Santa Catarina and Rio Grande do Sul.
2. Material and Methods
2.1 Study area description
An evaluation of precipitation projections in the region of the Machadinho Hydroelectric Power Plant, located in the Uruguay River basin (Figure 1). According to Schork et. Al. (2012), a Machadinho Hydroelectric Power Plant is located in the states of Santa Catarina and the Rio Grande do Sul between latitudes 27º31 'and 27º46' south and longitudes 51º47 'and 51º11' west.
The Basin extends between the parallels of 27º and 34º South latitude and the meridians of 49º30 'and 58º5'W. It covers an area of approximately 384,000 km2, of which 174,494 km2 are located in Brazil, equivalent to 2% of the Brazilian territory. According to Andreolli ,(2003) its Brazilian portion is in the southern region, comprising 46,000 km2 of the State of Santa Catarina and 130,000 km2 in the State of Rio Grande do Sul. It is bordered to the north and northeast by the Serra Geral, to the south by the border with the Eastern Republic of Uruguay, east by the Central Depression Riograndense and the west by Argentina.
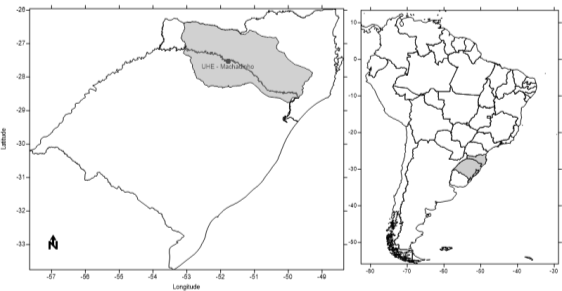
Figure 1. Study area localization.
2.2 Data description and climate model
The scenarios were generated using the models used in the Fifth Report of the Intergovernmental Panel on Climate Change (IPCC-AR5), based on an analysis of the seasonal variability of precipitation and the consequent variation in energy production.
The database used in this research is part of the Phase 5 Intercomparison of Matching Models (CMIP5) and contributed to the preparation of the fifth IPCC-AR5 report. The data were extracted from ACCESS model (The Australian Community Climate and Earth System Simulator).
According to Van Vuuren et al., (2011) in AR5 the scenarios are organized according to the RCPs. In this research, RCP 8.5 scenario was used which represents a scenario with a continuous population growth, resulting in high carbon dioxide emissions, with an increase Up to 4 ° C.
According to Silveira et al, (2016), this scenario is considered to be the most pessimistic for the 21st century in terms of greenhouse gas emissions, consistent with no policy change to reduce emissions and strong reliance on fossil fuels. The climatic projections of the precipitation series were divided into three scenarios: Scenario-1 (2026-2050), Scenario-2 (2051-2075) and Scenario-3 (2076-2100), the seasonal analysis was done for each of these scenarios.
3. Methodology
The monthly precipitation data were extracted from the IPCC-AR5 database, the information is provided in grid points, and Grads (Grid Analysis and Display System) software were used to extract the results. According to Souza (2004) Grads is a system of visualization and analysis of data in grid points, it works with binary data matrices, in which the variables can have up to four dimensions (longitude, latitude, vertical levels and time). After this stage, the historical data series and the data series with the climatic projections were organized. The projections were divided into three 25-year scenarios: Scenario-1 (2026-2050), Scenario-2 (2051-2075) and Scenario-3 (2076-2100). In the sequence precipitation anomalies were calculated from the following equation:
APre (%) = ((PMM – PMN)/ PMN)*100 (1)
Which:
APre (%) is the precipitation anomaly in percentage;
PMM is the mean precipitation of the analyzed month;
PMN is the climatological norm corresponding to the analyzed month.
World Meteorological Organization (WMO) defines climatological normal as averages of climatological data calculated for consecutive periods of 30 years.
4. Results and Discussions
The permanence curve is important for the study of precipitation variability, being possible to verify the probability of occurrence of the events that occur in the watershed. The figures show the permanence curves for Station 1 (Figure 3a) located at -26.25 ° latitude and -52.50 ° longitude and for station 2 (Figure 3b) located at -27.50 ° latitude And -50.63º longitude. In both stations, the trend in the increase of monthly average rainfall for the three scenarios was observed. Analyzing the third scenario of Posto 1, precipitation projections indicated an increase of around 400 mm, compared to scenarios 1 and 2. In relation to the lower precipitation rates scenario 1 presented values below 200 mm in 70% of the analyzed period. For station 2, the maximum precipitation presented values ranging from 600 to 900 mm around 5% of the time.
a)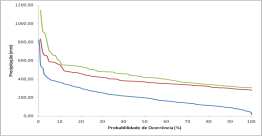
b)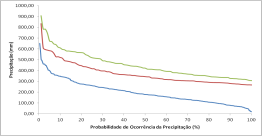
Figure 3. Permanence curve of precipitation projections for scenario 1 (blue line); Scenario 2 (red line); Scenario 3 (green line): a) Post 1 and b) Post 2
Figure 4 shows the positive anomalies in the two stations analyzed indicating a significant increase of the precipitation, mainly for the spring period, with an increase of around 200 mm, for the third scenario. Summer was the period that indicated the smallest increase in precipitation, with values around 30 mm above the climatological norm.
a)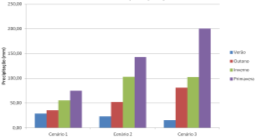
b) 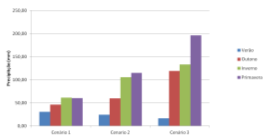
Figure 4. Seasonal Precipitation Anomalies: a) station 01 and b) station 02
Based on the average precipitation projections of the hydrographic basin where the Machadinho HPP is located, it was observed that the highest values of precipitation are found in the western half of the basin, fluctuating around 200 mm for scenario 1 (Figure 5a) .
Scenario 2 (Figure 5b) presented a precipitation projection around 238 mm and an increment around 64 mm for scenario 3 (Figure 5c), in relation to the first scenario analyzed, thus verifying a tendency in the increase of precipitation For the three scenarios in the Hydrographic Region of the Machadinho Hydroelectric Power Plant.
a)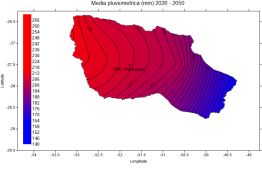
b) 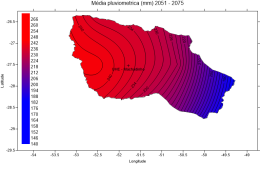
c)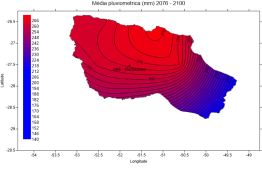
Figure 5. Precipitation projections: a) Scenario 1 (2026 - 2050; b) Scenario 2 (2051 - 2075); C) Scenario 3 (2076 - 2100).
5. Conclusion
The hydroelectric plants are in the first position in the Brazilian energy matrix, evidencing, therefore, the need to know the distribution of the pluviometric regime of the region. The model analyzed in this article presented a positive trend for precipitation in the period from 2026 to 2100, designing anomalies between 25 and 200 mm in each 24 - year period for the precipitation variable. A greater amplitude is observed in the precipitation of 2076-2100, indicating an increase in the occurrence of major precipitation events, mainly in the spring period, considering that the rains in the Machadinho HPP region are increasing in the scenarios analyzed, it is concluded That the level of the reservoir of the plant tends to increase, changing the pluviometric regime of the region.
Acknowledgement
This research did not receive any specific grant from funding agencies in the public, commercial, or not-for-profit sectors.
References
Ivanilto,A.(2003). Previsão de vazão em tempo real no Rio Uruguai com base na previsão meteorológica. Dissertação de Mestrado. Universidade Federal do Rio Grande do Sul.
Grimm, I. J. (2016). Mudanças Climáticas e Turismo: estratégias de adaptação e mitigação. Tese de Doutorado, Pós-graduação em Meio Ambiente e Desenvolvimento da Universidade Federal do Paraná. Curitiba, 248.
Moraes,F.(2013). Entenda como são feitos os relatórios do IPCC. Disponível em: <http://www.oeco.org.br/dicionario-ambiental/27621-entenda-como-sao-feitos-os-relatorios-do-ipcc/>. Acesso em: 06 maio 2016.
Nimer, E. (1989) Climatologia do Brasil.(2nd edition). Rio de Janeiro: IBGE.
Schork, G.,Hermes-Silva, S., Beux, L. F., Zaniboni-Filho, E., Nuñer, A. P. O. (2012). Diagnóstico da pesca artesanal na usina hidrelétrica de Machadinho, alto rio Uruguai – Brasil. Bol. Inst. Pesca, São Paulo, 38(2),97 –108.
Silveira,S.S., Souza Filho, F., Martins, E. S., Oliveira, J., Costa, Alexandre, Nobrega, M., Souza, S. A. (2011). Climate change in the São Francisco river basin: analysis of precipitation and temperature. RBRH, 21, 416 – 428. Porto Alegre abr. /jun. 2016.
Van Vuuren, D. P., Edmonsds, J., Kainuma, M., Riahi, K., Thomsonm, A., Hibbard, K., Hurtt, G. C., Kram T., Krey, V., Lamarque, J. F., Masui, T., Meinshausen, M., Nakicenovic, N., Smith, S. J., Rose, S. K. (2011). The representative concentration pathways: an overview. Climatic Change, 109, 5-31.
How to Cite
Pereira, F., Bierhals, E., Neris, J., Rippel, M., Brazil, C., Salvi, L., & Marçal, N. (2017). Evaluation Rainfall Regime at the Hydroelectric Power Plant toward Climate Change. Journal of Contemporary Urban Affairs, 1(3), 62-65. https://doi.org/10.25034/ijcua.2018.3682
This work is licensed under a Creative Commons Attribution - NonCommercial - NoDerivs 4.0.
"CC-BY-NC-ND"