|

|
Journal of Contemporary Urban Affairs
|
|
2022, Volume 6, Number 2, pages 113–141
Original scientific paper
Data Mining as a Method for Comparison of Traffic Accidents in Şişli District of Istanbul
1* Ph.D. Candidate Mert Ersen, 2 Professor Dr. Ali Hakan
3 Professor Dr. Semra Erpolat Taşabat
1 Graduate School of Science and Engineering, Department of Statistics, 100/2000 YÖK Doctoral Scholarship Sustainable and Intelligent Transportation Sub-Department, Yıldız Technical University, Istanbul, Turkey
2 Department of Statistics, Faculty of Art and Science, Yıldız Technical University, Turkey
3 Department of Statistics, Faculty of Arts and Sciences, Mimar Sinan Fine Arts University, Turkey
E-mail 1: mert_9034@hotmail.com , E-mail 2: hbuyuklu@yildiz.edu.tr E-mail 3: semra.erpolat@msgsu.edu.tr
|
|
ARTICLE INFO:
Received: 13 March 2022
Revised: 15 June 2022
Accepted: 25 June 2022
Available online: 7 July 2022
Keywords:
Geographic Information Systems;
Kernel Density Method;
Traffic Accidents;
Decision Trees;
Artificial Neural Networks;
Logistic Regression;
Naive Bayes.
|
ABSTRACT 
Studies to reduce traffic accidents are of great importance, especially for metropolitan cities. One of these metropolitan cities is undoubtedly Istanbul. In this study, a perspective on reducing traffic accidents was trying to be revealed by analyzing 3833 fatal and injury traffic accidents that occurred in the Şişli district of Istanbul between 2010-2017, with Data Mining (DM), Machine Learning (ML) and Geographic Information Systems methods (GIS), as well as traditional methods. It is aimed to visually determine the streets where traffic accidents are concentrated, to examine whether the accidents show anomalies according to the effect of the days of the week, to examine the differences according to the accidents that occur in the regions and to develop a model. For this purpose Kernel Density, decision trees, artificial neural networks, logistic regression and Naive Bayes methods were used. From the results obtained, it has been seen that some days are different from other days in terms of traffic accidents, according to the accident intensities and the performances of the modelling techniques used vary according to the regions. This study revealed that the ‘day of the week effect’ can also be applied to traffic accidents.
|
|
|
|
This article is an open-access article distributed under the terms and conditions of the Creative Commons Attribution 4.0 International (CC BY 4.0)

Publisher’s Note: Journal of Contemporary Urban Affairs stays neutral with regard to jurisdictional claims in published maps and institutional affiliations.
|
|
JOURNAL OF CONTEMPORARY URBAN AFFAIRS (2022), 6(2), 113-141.
https://doi.org/10.25034/ijcua.2022.v6n2-2
www.ijcua.com
Copyright © 2022 by Ph.D.Candidate Mert Ersen, Professor Dr. Ali Hakan Büyüklü, Professor Dr. Semra Erpolat Taşabat.
|
|
|
|
1 . Introduction
Traffic accidents have become an important problem in Turkey due to the increasing urban population and the parallel increasing unplanned urbanization and vehicle use. Traffic accidents that occur every year cause serious traumas, injuries, and deaths as well as material and moral consequences. According to the Turkish Statistical Institute Highway Traffic Accident Statistics 2020 news bulletin, 983.808 traffic accidents occurred even in 2020 alone, and 833.533 of these accidents resulted in property damage and 150.275 deaths and injuries (TURKSTAT, 2020). In the stage of sustainable development of cities related to transportation, the main cause of the accidents cannot be determined due to the lack of an applicable transportation policy. For this reason, it is thought that analysing big data by using new data technologies will contribute significantly to the reduction of future traffic accidents (Camkesen & Bayrakdar, 1999). Regarding big data; the use of new data technologies such as Data Mining (DM), machine learning, cloud computing and the internet of things contributes significantly to eliminating the transportation problem and reducing traffic accidents in the cities of the future (Khokale & Ghate, 2017). It is very difficult to benefit from big data using traditional methods and technologies. For this reason, various methods have been tried to be developed to analyse and interpret big data (Lin, Wang, & Sadek, 2014). DM, which is one of these methods, has an important place in obtaining meaningful information from databases where a very large amount of information is stored and it is very important to support it with developing technology (Bayrak & Kirci, 2019). When the previous studies are examined, it has been revealed that there is no study to determine the traffic accident points in Şişli district and to reduce the accidents in the regions where these accidents are concentrated.
Accident analysis studies are mostly based on statistical data. Since analyses will be made based on big data with this study, we can call the accident analysis as “Accident Analytics”. Another reason why accident analysis is named as accident analytics in the study is that traffic accidents cannot be determined in advance in terms of place and time and cannot be interpreted well enough (Ersen, Büyüklü, & Taşabat, 2021). Accident analytics, which enables traffic accident analysis based on concrete traffic accident data and traffic information, will help you to understand the accidents in detail and to determine what can be done to prevent future traffic accidents and will help to minimize traffic accidents (Ersen, Büyüklü, & Taşabat, 2021). Traffic Accident Analytics aims to create safe road and vehicle usage opportunities by establishing smart systems using the latest technologies based on the most appropriate scientific methods. While doing this, it discovers the meaningful pattern in the data by using the available data structures, optimization, simulation methods, data analytics and data mining (Ersen, Büyüklü, & Taşabat, 2021).
In these analyses, methods such as the accident frequency (number) method and accident recurrence rate method are used to determine accident points. In addition, this study aimed to visualize the regions where the accidents are concentrated, determined by the accident analysis studies with the Kernel Density Estimation method (Thakali, Kwon, & Fu, 2015; Mohaymany, Shahri, & Mirbagheri, 2013). Identifying the cause of location-based similar accidents is very important in terms of ensuring the safety of people in traffic and reducing the number of accidents (Gündoğdu, 2010; Saplıoğlu & Karaşahin, 2006). During the determination of these processes, the location of the accidents was visualized with GIS, making the information easier to understand (Erdogan, Yılmaz, Baybura, & Gullu, 2008; Dereli & Erdogan, 2017; Le, Liu, & Lin, 2019).
In order to develop effective road safety measures that can be used to reduce traffic accidents, it is necessary to identify the regions (hot spots) where the accidents are concentrated (Xie & Yan, 2008). The Kernel Density estimation method is the most common method used in spatial analysis studies in GIS and it is known to give successful results in determining hot spots (Ersen, Büyüklü, & Taşabat, 2021). The Kernel Density estimation method is based on the process of determining the accident intensity by weighting in a determined impact area. In this method, the density of the points falling into the circle with a defined radius and the point density that changes as you move away from this source are expressed (Xie & Yan, 2013; Bil, Andrasik, & Janoska, 2013).
For this purpose, first of all, the streets where traffic accidents are concentrated in Şişli district were determined with Exploratory Data Analysis Tools (EDA). The distribution of the accidents according to the intersections and streets of the region was analysed with the SAS Enterprise Guide software. The kernel Density estimation method was used to visualize the accident densities at these intersections. By making use of the ArcGIS 10.7 software, information was visualized with GIS and it was made easier to understand the places where the accidents were concentrated. Then, the outputs of the results obtained on the day-based significance analysis of the accidents were examined for the effect on the day of the week and the differences were interpreted according to the streets where the accident density was determined. Finally, the data set and divided into 3 parts with SAS Enterprise Miner software for training, validation and testing purposes and appropriate models (Decision Trees, Artificial Neural Networks, Logistic Regression and Naive Bayes) are selected. The ratios of training, validation and test sets were determined as 60%, 30% and 10%, respectively. The success of the modelling techniques used was determined by the accuracy, error rate and ROC values, and it was observed that the successful performances of the models changed on the streets with high accident density.
2 . Materials and Methods
In this study, the effect of the day of the week on the accidents was investigated after the statistical information about the traffic accident density was analysed. The day of the week approach, which is frequently used in studies on financial markets and explains the price behaviour of stocks, which is expressed as an anomaly, has been examined for traffic accidents (Orhan, Emikönel, & Emikönel, 2021; Aharon & Qadan, 2019). A total of 3833 traffic accidents death and injury occurred in the whole Şişli district between 2010 and 2017 and the traffic accidents on the streets where the accident density was determined in the Kernel Density maps, the differences in the days in terms of the effect of the day of the week were evaluated according to the regions. It is important for the units and researchers to see that some days differ from other days in traffic accidents so that they can make a more effective assessment (Yılmaz & Akkaya, 2020; Cengiz, Bilen, Büyüklü, & Damgacı, 2017). Daily traffic accidents were used to investigate the effect on the day of the week for a total of 3833 fatal and injury traffic accidents that occurred in Şişli between 01.01.2010 and 31.12.2020 and on the traffic accidents on the streets where the accident density was determined.
Day of the week anomaly in traffic accidents was investigated through the linear regression equation (1) using dummy variables (Evci, 2020; Ersen, Büyüklü, & Taşabat, 2021).
 (1)
(1)
 = Daily traffic accidents by numbers
 = Base day
Because of the multicollinearity problem we left one day dummy. This dummy shows up on the beta one.
 = Average traffic accident for each day of the week
 = Dummy variable for days of the week
 = Independent variables
 = Error term with zero mean and constant variance
In regression analysis, the dependent (affected) variable is frequently affected by qualitative variables as well as numerical values. Therefore, it is important, how to include qualitative variables in the model.
Since qualitative variables usually indicate the presence or absence of a feature, dummy variables that take values of 0 or 1 are used to quantify these features. A variable’s value of 0 indicates the absence of a feature and a value of 1 indicates the presence of a feature. In the models established for traffic accidents, the dummy variable takes the value of 1 for observations corresponding to that day and 0 for other observations. In this context, in the models established for the day, the null hypothesis is that the average traffic accidents of the days are equal and the alternative hypothesis is that there is a difference in the average traffic accidents of the days and the effect on the day of the week effect (Gujarati & Porter, 2009). No additional independent variables were added to the linear regression equation established for the day of the week. This is because this study aimed to determine whether some days in traffic accidents are statistically different from other days in terms of traffic accidents by using only OLS (Least squares) t-test and ANOVA analysis (Gujarati & Porter, 2009).
Dummy variables can be used as easily as quantitative variables in the regression model. However, in a regression model, all explanatory variables can consist of dummy variables. These models are called ANOVA models. In addition, models in which qualitative and quantitative variables coexist are called the ANCOVA model. Since no quantitative explanatory variables were used in the established models, these models were accepted as equivalent to the ANOVA model. In this study, only fatal and injury accidents were studied, and material damage accidents and much information could not be obtained. If this information could be obtained, the model could be expressed with the ANCOVA model since an additional quantitative variable would be added to the model (Gujarati & Porter, 2009; Ersen, Büyüklü, & Taşabat, 2021).
Finally, decision trees, artificial neural networks, logistic regression and Naive Bayes models were used in this study for modelling techniques, respectively, and the success of these methods in classifying traffic accident results as fatal and injury accidents were compared in the whole Şişli district and on the streets where the accident density was determined (Yavuz, Ergül, & Aşık, 2021; Özden & Acı, 2018; Singh & Kaur, 2016; Chong, Abraham, & Paprzycki, 2005). Thus, it is aimed to determine the most appropriate classification method according to the regions in reducing the future traffic accidents by determining the fatal and injury accident points with the Kernel Density method.
2.1 Decision Trees
Decision trees are one of the most preferred DM approaches for classification and prediction problems. It is simpler than other classification methods because it can be expressed visually, easily interpreted and understood (Zhao & Zhang, 2008; Çalış, Kayapınar, & Çetinyokuş, 2014). Decision trees start with a single root and continue with the formation of a leaf node (internal node) after each split. It represents a decision whose outcome is expressed in probabilities at each internal node. Decision trees are advantageous for decision-makers due to their ease of understanding and interpretation, low cost and good reliability. However, the disadvantages of decision trees are that they can produce complex trees that do not explain the data well, that they are not very successful in estimating continuous values and that they fail to build a model when the number of classes is large and the number of learning cluster samples is small. One of the most important issues in decision trees is to determine the best separation criterion. The separation rule determines by which criteria the target variable should be divided. The most commonly used separation rules are entropy, Gini and the chi-square test. A decision tree method has been developed for each different separation rule in decision trees. For example; in decision tree methods such as ID3, C4.5, C5 the most distinguishing feature is determined by entropy (Long, Griffith, Selker, & D'Agostino, 1993; Emel & Taşkın, 2005). On the other hand, Gini in the CART method and chi-square division rule in the CHAID method are selected. Since the type of the target variable in SAS Enterprise Miner is binary scale, entropy, Gini and chi-square can be selected as separation methods in the Nominal Target Criterion. In this study, the entropy separation method is preferred among these methods. In the Sub-layer split node property (Split Search Subtree node), Largest is selected for the method option and Misclassification is selected from the Assessment Measure property (Walsh, 2005; Şahin, 2018; Yılmaz, 2012). These options were chosen because they gave the best results experimenting with different ways.
2.2 Artificial Neural Networks
After the decision tree analysis, the artificial neural networks (ANN) model was examined secondly. ANN method, one of the most powerful methods in DM, is an artificial intelligence research field inspired by the working principle of the human brain. The first studies in this method started with the modelling of neurons that make up the human brain and their application in computer systems. In recent years, with the developments in the computer system, it has become a method that can be used in many areas (Budak & Erpolat, 2012; Olutayo & Eludire, 2014). ANN method; ıt is examined in three main layers, namely the input layer, the intermediate (hidden) layer and the output layer. This method is likened to a black box since the exact relationship between the input and output layers cannot be established. The reason for making a black box analogy to this method is related to the unknown, what is in the hidden layer. In the ANN method, only the results are concerned. Therefore, the formation of the results with this method cannot be explained. In the ANN method, this situation causes, the researchers to lose their confidence. In addition, one of the most important disadvantages of the model is that it produces very complex models. However, in recent years, studies in artificial neural networks, which are frequently used in almost all fields from financial fields to medicine, from the defence industry to automation and control fields, have increased the interest in this method. The biggest advantage of the artificial neural network model over traditional methods is that it can give positive results in solving problems that are complex to solve, the data set is not linear, there are missing or incorrect data and multidimensional. Also, when compared with statistical methods, another advantage of this method is that it does not make any assumptions about data properties and distributions (Budak & Erpolat, 2012; Duran, Pamukçu, & Bozkurt, 2014).
The formulas used to combine the information produced in the hidden layer in SAS Enterprise Miner are located in the hidden layer combination functions section. The formulas used to transform the combined value in the hidden layer are in the hidden layer activation functions section. The outputs of one layer are expressed as the inputs of the next layer. In addition, there are combinations and activation sections for units in the target layer in SAS Enterprise Miner. The formulas used to combine the information produced in the target layer are in the target layer combination functions and the formulas used to transform the combined value in the target layer are in the target layer activation functions section. The target variable activation function is used to interpret the information produced in the target layer. Combination and activation processes in the hidden layer and the target layer are important elements in a neural network model. For this reason, many artificial neural network models are produced by SAS Enterprise Miner from the options of hidden layer combination function, hidden layer activation function, target layer combination function and target layer activation function. In our model, when the hidden layer combination function, hidden layer activation function, target layer combination function and target layer activation function settings are set as default, it is seen that the success rate of the model is high. In this study, the model selection criterion property is set to the Profit/Loss. When the model selection criterion is set to the Profit/Loss; for the cases in the validation data set, the model that maximizes the profit or minimizes the loss is selected (Şahin, 2018).
2.3 Logistic Regression
When the dependent variable is continuous, the linear regression equation is usually used, whereas when the dependent variable is categorical, logistic regression is used. The logistic regression method is used in many fields of study such as economy, education, health, Biostatistics, banking, finance sector and marketing. In the logistic regression model, assumptions such as the normal distribution of the error terms in the linear regression model, the expected value of the error terms being zero, the error terms being constant to the same variance, the absence of autocorrelation and the independent variable not being a random variable are not sought (Şen, 2014).
In logistic regression analysis, the “Maximum Likelihood” method is used to estimate the coefficients of the variables. In logistic regression, unlike normal regression, the dependent variable is binary; the dependent variable can take the value 1 with probability q, or 0 with 1-q probability.
Normal regression can be represented by equation (2).
While 
 (2)
(2)
The value of , a logistic function other than the linear function must be used to constrain it from 0 to 1 by changing monotonically with x.
Equation (in 3, 4 and 5) shows the calculation of and  values, respectively.
 (3)
(3)
 (4)
(4)
In this case, the output can be represented by equation (5) in the input logistic regression model.
 (5)
(5)
The significance of the coefficients estimated by the maximum likelihood method is determined by the “likelihood ratio test, G statistic” based on likelihood functions, or the “Wald test” using the standard normal distribution approach of the distribution of the test statistic of interest (Yavuz & Çilengiroğlu, 2020).
Odds ratios are used to interpret the coefficients in logistic regression. The “odds ratio” can be defined as the ratio of preference to not preference in any event. For example, if the probability of an event of interest is (p), the probability of the other event occurring will be (1-p). If the odds value is between 0 and 1, the risk factor is “protective” for the outcome variable, if the odds value is 1, there is no difference between the risk factor and the outcome variable and if the odds ratio is greater than 1, there is a difference between the risk factor and the outcome variable and it is stated that this difference will be explained mathematically by a multiple. In addition, the confidence interval for the odds ratio should not include 1 (Yavuz & Çilengiroğlu, 2020).
2.4 Naive Bayes
Naive Bayes classification is one of the most preferred classification methods in which class estimation is based on Bayes theorem. In this method, how the data is classified is more important than its classification. The most important rule of the Naive Bayes method is that it estimates the class condition probabilities unbiasedly, assuming that the attributes are independent of each other. All attributes are considered to be equally important. The probability of the outcome is expressed by multiplying the probabilities of all the attributes that affect that outcome (Yavuz, Ergül, & Aşık, 2021).
While Bayes theorem is used for classification, the case with the highest probability among the resulting probabilities is chosen as the target class as in equation (6).
 (6)
(6)
But when (v) the input instance (v) has more than one attribute, the Bayesian formula changes to a different form. In the target class prediction for the data sample with the intersection view of many features, the product of the conditional probabilities for all features should be calculated as in equation (7).
 (7)
(7)
The most important difference to be noted in the calculations of the Naive Bayes classifier and Bayes Theorem is that the classifiers try to find the target class rather than the probability value. Therefore, the value in the denominator can be neglected, as it is common to the probability calculations of all target classes (Orhan & Adem, 2012). For this reason, the formula that we will pay attention to while finding the target class is shown in equation (8).
 (8)
(8)
The Naive Bayes method is an advantageous method because it is easy to understand, can be trained simply with a small data set, and works very quickly compared to other methods. However, it also has disadvantages as it accepts that each attribute is independent of each other and the relationship between the variables cannot be shown.
2.5 Comparison of Models
It is necessary to look at some comparison criteria in evaluating the classification performance of models made using datasets. Accuracy rate, error rate and ROC (Receiver Operating Characteristic Curve) were used in this study (Şahin, 2018; Duran, Pamukçu & Bozkurt, 2014). The classification matrix showing the result and the actual situation as a result of the classification technique is given in table 1.
Table 1. The classification matrix used in the analysis.
|
|
Actual Situation
|
|
|
True (+)
|
False (-)
|
|
Estimation of Classification Method Result
|
True (+)
|
TP
|
FP
|
|
False (-)
|
FN
|
TN
|
|
|
|
|
|
TP (True Positive): Number of True Positives = Number of True Positive Samples
TN (True Negative): Number of True Negatives = Number of True Negative Samples
FP (False Positive): Number of False Positives = Number of False Positive Samples
FN (False Negative): Number of False Negatives = Number of False Negative Samples
N = TP+ TN+ FP+ FN
2.5.1 Accuracy Rate
The percentage of samples correctly classified. The calculation is done as shown in equation (9).
 (9)
(9)
2.5.2 Error Rate
It is calculated as the opposite of the accuracy rate method. The percentage of samples that were incorrectly classified. Calculation is done as shown in equation (10).
 (10)
(10)
2.5.3 Receiver Operating Characteristics Curve (ROC)
One of the most preferred methods for evaluating the performance of classification systems is the Receiver Operating Characteristic Curve (ROC). This curve is another method that allows us to compare the models by measuring the accuracy of the estimation of the established model.
The Receiver Operating Characteristic Curve (ROC) is an effective method that uses classifiers by visualizing them according to their performance. The ROC curve is a probability curve used to show the balance between the true positive rate and the false positive rate of a classifier. The X-axis of a ROC curve shows the false positive rate and the Y-axis the true positive rate. With this curve, the differences between the classes to be estimated as a result of the model can be observed. The ROC-AUC measure represents the area under the ROC curve. It is understood that ML models with a large covered area are more successful than other methods in distinguishing given classes. The ideal value for AUC is 1. The advantages of using this curve are that the Roc curve can be directly compared to the curves of different models and a summary of the performances of the models with the area under the curve (AUC) is shown (Duran, Pamukçu, & Bozkurt, 2014).
3 . Application Results
In this study, when the Kernel Density map is examined, Şişli district is handled in 2 regions based on traffic accidents and in 3 sections as Büyükdere Street. This distinction was made due to the high accident densities in 2 regions and some parts of Büyükdere Street. Thematic accident maps of the determined regions according to accident occurrence types and accident density maps with the Kernel Density method were examined with the help of statistical analysis. Then, the year, month and day data of the traffic accidents occurred and it was investigated whether the accidents in these regions had a statistically significant day effect. Thus, the differences according to the day of the week affect of the accidents according to the accidents occurring in the regions were interpreted. Finally, by establishing decision trees, artificial neural networks, logistic regression and Naive Bayes models as modelling techniques, the success of the methods according to each other; The accuracy rate was compared with the error rate and ROC value. The independent variables included in the analysis; are accident month, accident day, accident time zone, traffic accident type, weather condition, day status, road surface, road geometric horizontal, road geometric vertical, road geometric intersection, road geometric walkway, lane line, lighting, sidewalk, traffic lamp, type pf road and number of vehicles. The target variable, which is the dependent variable, is the "accident result" variable. The names of the variables used in the analysis, their roles in the model, variable type, value names and label values are given in table 2 below.
Table 2. Table of variables used in the analysis.
|
Variable Name
|
The Role of the Variable in the Model
|
Variable Type
|
Value Names
|
Label Values
|
|
Accident Month
|
Input
|
Nominal Scale
|
January(1), February(2), March(3), April(4), May(5), June(6), July(7), August(8), September(9), October(10), November(11), December(12)
|
1-12
|
|
Accident Day
|
Input
|
Nominal Scale
|
Monday(1), Tuesday(2), Wednesday(3), Thursday(4), Friday(5), Saturday(6), Sunday(7)
|
1-7
|
|
Accident Time Zone
|
Input
|
Ordinal Scale
|
00:00-04:00(1), 04:00-08:00(2), 08:00-12:00(3), 12:00-16:00(4), 16:00-20:00(5), 20:00-24:00(6)
|
1-6
|
|
Traffic Accident Type
|
Input
|
Nominal Scale
|
Head-On Collision(1), Rear Impact Collision(2), Side-Impact Collision(3), Side-to-Side Collision(4), Hitting a Stationary Vehicle(5), Multiple Vehicle Collision(6), Multiple Hitting(7), Hitting Fixed Objects(8), Hitting Pedestrian(9), Animal Impact(10), Vehicle’s Rolling Over(11), Run-Off Road(12), Falls from Vehicles(13)
|
1-13
|
|
Weather Condition
|
Input
|
Nominal Scale
|
Sunny(1), Cloudy(2), Foggy(3), Rainy(4), Snowy(5), Stormy(6), Strong Wind(7)
|
1-7
|
|
Day Status
|
Input
|
Nominal Scale
|
Daytime(1), Night(2), Twilight(3)
|
1-3
|
|
Road Surface
|
Input
|
Nominal Scale
|
Dry(1), Wet(2), Snowy(3), Iced(4), Flood(5), Other Floating Floor(6)
|
1-6
|
|
Road Geometric Horizontal
|
Input
|
Nominal Scale
|
Flat Road(1), Bend(2), Dangerous Bend(3)
|
1-3
|
|
Road Geometric Vertical
|
Input
|
Nominal Scale
|
Without Slope(1), Sloping(2), Dangerous Slope(3), Overhead(4)
|
1-4
|
|
Road Geometric Intersection
|
Input
|
Nominal Scale
|
Three Way T Intersection(1), Three Way Y Intersection(2), Four Way Intersection(3), Roundabout(4), Interchange(5), Other Intersection(6), No Intersection(7)
|
1-7
|
|
Road Geometric Walkway
|
Input
|
Nominal Scale
|
Controlled Railway(1), Uncontrolled Railway(2), School Crossings(3), Pedestrian Crossing(4), No Passage(5)
|
1-5
|
|
Lane Line
|
Input
|
Nominal Scale
|
Available(1), Faulty(2), Unavailable(3)
|
1-3
|
|
Lighting
|
Input
|
Nominal Scale
|
Available(1), Faulty(2), Unavailable(3)
|
1-3
|
|
Sidewalk
|
Input
|
Nominal Scale
|
Available(1), Not Suitable(2), Unavailable(3)
|
1-3
|
|
Traffic Lamp
|
Input
|
Nominal Scale
|
Available(1), Faulty(2), Unavailable(3)
|
1-3
|
|
Type of Road
|
Input
|
Nominal Scale
|
Divided Road(1), One Way Road(2), Two-way road(3), Other(4)
|
1-4
|
|
Number of Vehicles
|
Input
|
Interval Scale
|
1, 2, 3, 4, 5, 6, 7, 8, 9
|
1-9
|
|
Accident Result
|
Target
|
Binary Scale
|
Fatal Accident(0), Injury Accident(1)
|
0, 1
|
The "accident result" variable, which is determined as the target variable in the current data set, is at two levels as fatal and injury and the number of fatal accidents are considerably lower than the number of injury accidents. However, in this study, this special case was not taken into account in the data set, as the aim of this study is to help predict which possible accidents will be involved in the future by classifying fatal and injury traffic accidents and to offer a different perspective to the studies in this field. From the results given in detail in the later parts of the study, it was seen that this situation did not affect the model success rates.
3.1 The Entire District of Şişli Results
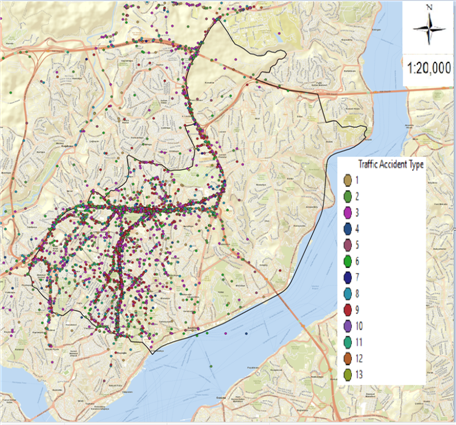
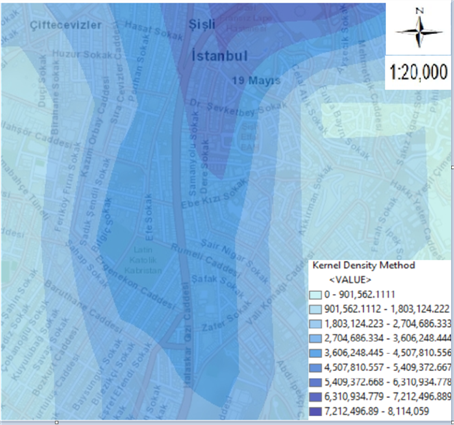
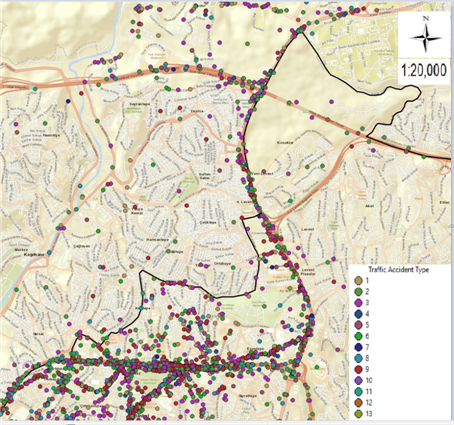
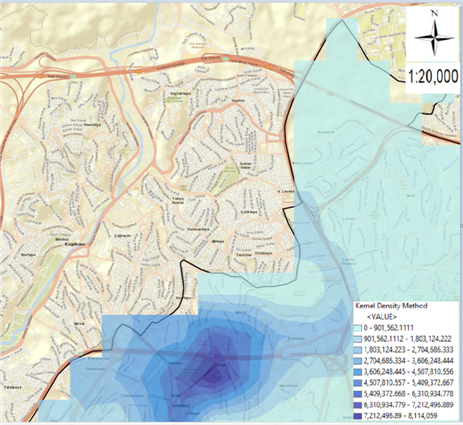
Figure 1. Maps of traffic accidents in Şişli district: (a) Thematic accident map by type of accident; (b) Kernel Density method map; (c) Thematic accident map of fatal accidents; (d) Thematic accident map of injury accidents.
In figure 1, maps of a total of 3833 fatal and injured traffic accidents that occurred between 2010 and 2017 in Şişli district are given. When we examine the thematic accident map according to the type of accident in figure 1 (a) and the Kernel Density method map in figure 1 (b), it is seen that the streets with the highest number of accidents are Büyükdere Street, Halaskargazi Street and Cumhuriyet Street. When the thematic accident map of fatal accidents in figure 1 (c) and the thematic accident map of injury accidents in figure 1 (d) are examined, it is observed that fatal accidents are scattered and injury accidents spread in a clustered manner at certain points. The meaning of the label values of 13 types of accidents in figure 1 (a) and the label values of the accident result values in figure 1 (c) and figure 1 (d) are given in table 2. In the examination made with the help of frequency analysis, it was seen that 3833 fatal and injury traffic accidents occurred in Şişli district, 3805 of which occurred as injury accidents and 28 accidents resulted as fatal accidents. When we evaluate the fatal accidents, according to the type of accident, it is seen that the most accident is in the form of hitting a pedestrian, followed by the accidents that occur in the form of hitting a stationary vehicle. When we examine the accidents that resulted in injury, according to the type of accidents, it was found that the most accidents were in the form of side collisions, followed by pedestrian collisions and rear collisions. When we look at the points where fatal accidents occurred in figure 1 (c), it was observed that the highest number of fatal accidents occurred on Büyükdere Street with 9 accidents. It was observed that 1 fatal accident occurred on Halaskargazi Street and Cumhuriyet Street, which are the other streets examined in this study. When we look at the points where the injury accidents occurred in figure 1 (d), it was found that the most injury accident occurred on Büyükdere Street with 800 accidents. It was concluded that 288 injury accidents occurred on Halaskargazi Street and 146 injury accidents occurred on Cumhuriyet Street, which is one of the other streets examined. It is aimed to analyze the dangerous accident points in reducing the accidents by correctly classifying the accident results of fatal and injury traffic accidents in the whole Şişli district and on the streets where the accident density is determined by the most successful DM method.
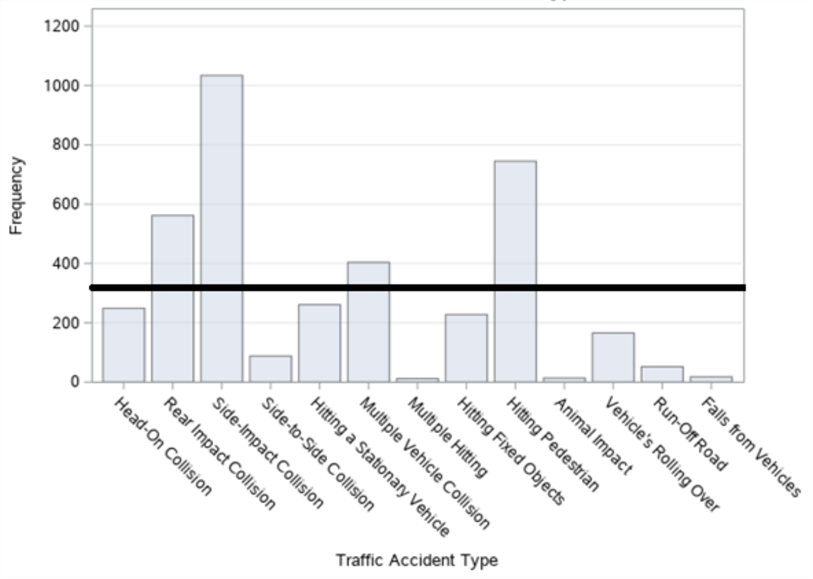
Figure 2. Bar graph of traffic accidents in Şişli district by accident type.
When the thematic accident map according to the type of accidents in figure 1 (a) and the bar graph made for the type of accidents in figure 2 are examined, it is seen that the accidents occurred in the form of a side-impact collision the most, followed by the accidents that occurred in the form of hitting the pedestrian and rear impact collision. It was observed that 13 types of accidents occurred on the thematic accident map by type of accident. In the variable name column of table 2, the type of accident and label values between 1 and 13 are given.
Table 3. Number of accidents by streets.
|
Street Name
|
Street Length
|
Number of Accidents
|
Number of Accidents Per Meter
|
|
Halaskargazi Street
|
1300 m
|
289
|
0.222
|
|
Cumhuriyet Street
|
1300 m
|
147
|
0.113
|
|
Büyükdere Street
|
4200 m
|
809
|
0.192
|
As can be seen in table 3, it is seen that in Şişli district, the most fatal and injury accident with 809 accidents was on Büyükdere Street, followed by the accidents on Halaskargazi Street with 289 accidents and Cumhuriyet Street with 147 accidents. When the number of accidents per meter is examined, it is concluded that the street with the highest accident density is Halaskargazi Street.
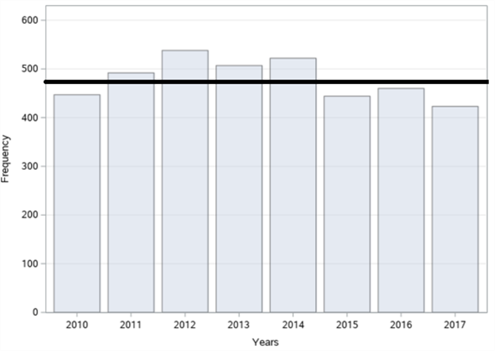
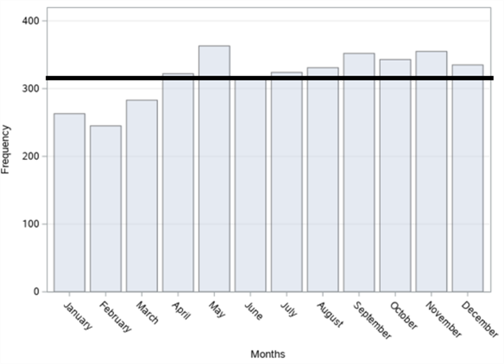
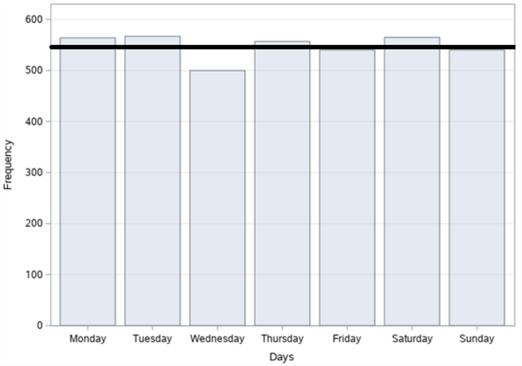
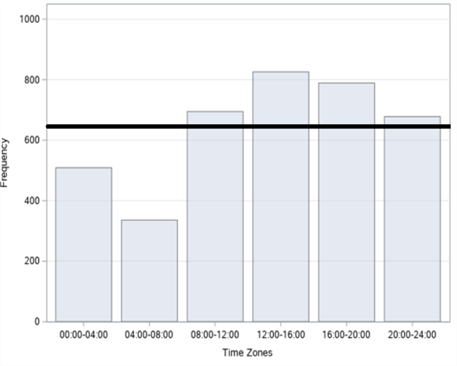
Figure 3. Bar graphs of the number of traffic accidents in Şişli district: (a) By years; (b) By months; (c) By days; (d) By time zones.
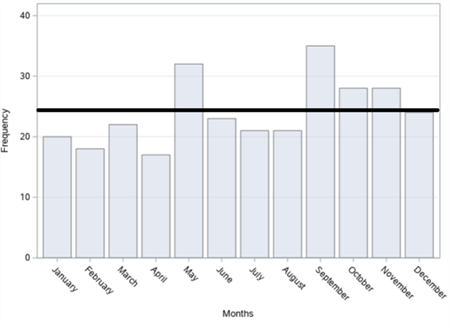
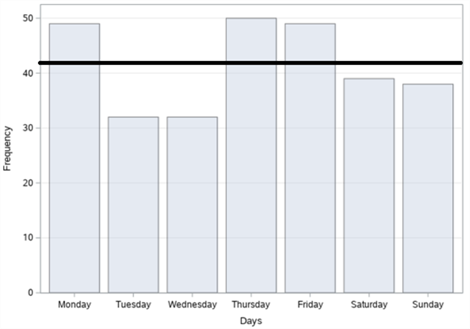
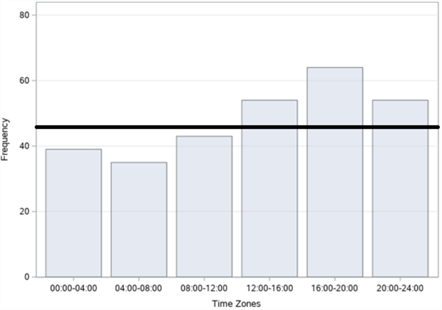
In figure 3, bar graphs of the number of accidents, according to years, months, days and time zones, respectively, of a total of 3833 fatal and injury traffic accidents that occurred in the Şişli district between 2010-2017 are given. When we examine it according to the years in figure 3 (a), it is seen that the highest number of accidents was in 2012 with 538 accidents and the least accident was in 2017 with 423 accidents. In figure 3 (b), when we examine it by months, it is observed that the highest number of accidents occurred in May with 363 accidents, and the least accident occurred in February with 245 accidents. When we examine it according to the days in figure 3 (c), it is seen that the highest number of accidents occurred on Tuesday with 567 accidents and the least number of accidents was on Wednesday with 500 accidents. When we examine these accidents, according to the time zones in figure 3 (d), it is concluded that the highest number of accidents occurred between 12:00 and 16:00 with 826 accidents and the least accident occurred between 04:00 and 08:00 with 336 accidents.
First of all, it was investigated whether the traffic accidents have a statistically significant day effect on the year, month and day data in the whole Şişli district.
Table 4. Showing data entry in excel in the model established to determine whether there is a day effect on the accidents.
|
Year
|
Month
|
Daily Accident Numbers
|
Friday
|
Saturday
|
Sunday
|
Monday…
|
Thursday
|
|
2010
|
January
|
1
|
1
|
0
|
0
|
0
|
0
|
|
2010
|
January
|
0
|
0
|
1
|
0
|
0
|
0
|
|
2010
|
January
|
2
|
0
|
0
|
1
|
0
|
0
|
|
2010
|
January
|
1
|
0
|
0
|
0
|
1
|
0
|
|
…
|
…
|
…
|
…
|
…
|
…
|
…
|
…
|
|
2017
|
December
|
0
|
0
|
1
|
0
|
0
|
0
|
|
2017
|
December
|
1
|
0
|
0
|
1
|
|
|
In order to investigate whether a total of 3833 fatal and injured traffic accidents that occurred between 2010-2017 in the Şişli district have a day effect, they were entered as shown in table 4. Here, the daily accident number value in the first line shows that 1 accident occurred on Friday, January 1, 2010, and the daily accident number value in the last line shows that 1 accident occurred on Sunday, December 31, 2017. As the daily accident number values change year, month and day, the data entry of the model was made by looking at the number of accidents that occurred on that day. Since January 1, 2010, coincided with Friday, the data were started on Friday.
The statistical model used is as in equation (11):
 (11)
(11)
To avoid multicollinearity, Monday was taken as the base day and excluded from the model. The regression outputs of the model are given in table 5.
Table 5. Table of coefficients in the model established to determine whether there is a day effect on accidents.
|
|
Unstandardized Coefficients
|
Standard Coefficients
|
|
|
|
Model
|
B
|
Standard Error
|
Beta
|
t
|
Significance Level
|
|
Constant
|
1.343
|
0.057
|
|
23.449
|
0.000***
|
|
Tuesday
|
0.022
|
0.081
|
0.006
|
0.266
|
0.790
|
|
Wednesday
|
-0.144
|
0.081
|
-0.043
|
-1.777
|
0.076*
|
|
Thursday
|
-1.293E-15
|
0.081
|
0.000
|
0.000
|
1.000
|
|
Friday
|
-0.053
|
0.081
|
-0.016
|
-0.660
|
0.509
|
|
Saturday
|
0.006
|
0.081
|
0.002
|
0.079
|
0.937
|
|
Sunday
|
-0.049
|
0.081
|
-0.015
|
-0.601
|
0.548
|
|
|
|
|
|
|
|
*** 1% significance level
* 10% significance level
Table 5 shows (***) 1% significance level, (*) 10% significance level. During the day-based significance study, it was observed that Wednesday was different from other days in terms of accident numbers at the 10% significance level. It has been observed that the other days, except Wednesday, do not have a significant day effect, with Monday as the base day. The constant was found to be statistically significant at the 1% significance level. This indicates that Monday has a significant day effect on traffic accidents. When the units trying to prevent traffic, and accidents deal with this study, they should investigate the reason why Monday and Wednesday show anomalies from other days.
|

(a)
|
(b)
|
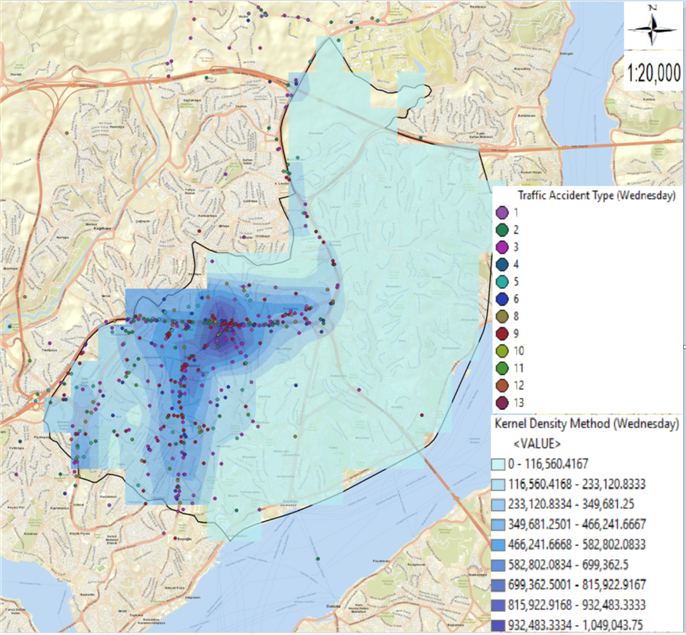
Figure 4. Kernel Density method maps of traffic accidents on Monday and Wednesday in Şişli district: (a) Kernel Density method map of accidents on Monday; (b) Kernel Density method map of accidents on Wednesday.
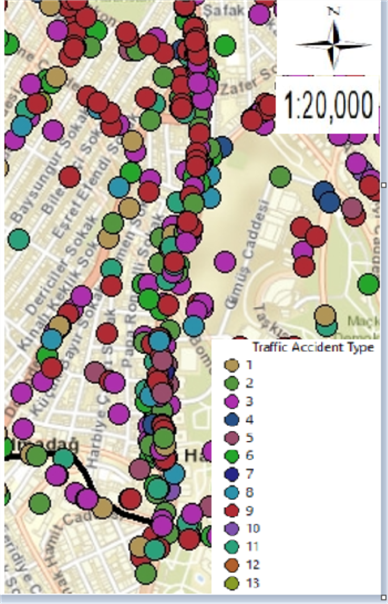
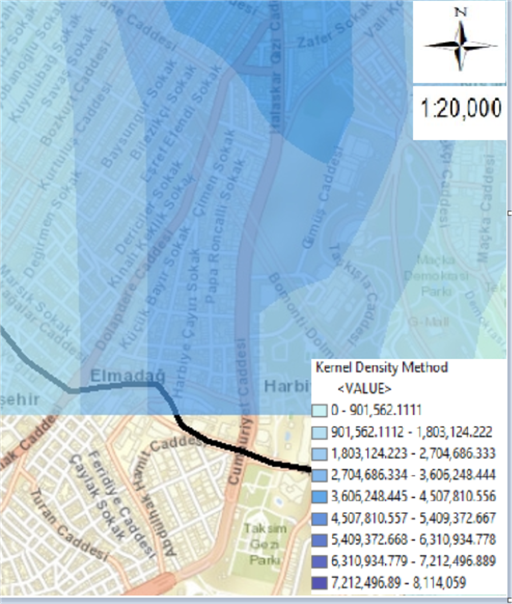
In figure 4, the Kernel Density method maps of traffic accidents on Monday and Wednesday, respectively, are given. When the Kernel Density method map of the accidents on Monday is examined in figure 4 (a), it is seen that the accidents are more in Büyükdere, Halaskargazi, Cumhuriyet, Abide-i Hürriyet, Mecidiyeköy Road, Piyalepaşa Boulevard, Cendere, Darülaceze and Talatpaşa streets. On Monday, it was observed that most accidents occurred in the form of side collisions on Büyükdere, Halaskargazi and Cendere streets. It has been observed that in the accidents on Cumhuriyet Street on Monday, the most accidents occurred in the form of rear-end collisions, and on Piyalepaşa Boulevard, the highest number of accidents occurred as rear-end collisions and pedestrian collisions. On Monday, it was concluded that the highest number of accidents occurred in the form of pedestrian collisions on Mecidiyeköy Road, Darülaceze and Talatpaşa streets. In the accidents that occurred on the Abidei Hürriyet Street on Monday, it was observed that the highest number of accidents was equally in the form of chain collisions and pedestrian collisions. When the Kernel Density method map of the accidents on Wednesday is examined in figure 4 (b), it is understood that the accidents are mostly in Halaskargazi, Abidei Hürriyet, Kurtuluş, Ortaklar, Piyalepaşa Boulevard, Ayazağa, Büyükdere, Cendere, Cumhuriyet and Darülaceze streets. When we examine the accidents that took place on Wednesday, it was seen that the most accidents in Abidei Hürriyet, Ayazağa, Büyükdere and Cumhuriyet streets were in the form of side collisions. On Wednesday, it was concluded that the most accidents on Piyalepaşa Boulevard were equally rear-ending and side-impacted. In the accidents that took place on Wednesday, it was observed that the most accident occurred in the form of pedestrian collisions in Halaskargazi, Kurtuluş, Ortaklar and Darülaceze streets. On Cendere Street, on Wednesday, it was observed that most accidents were in the form of mutual collisions. The meaning of the label values of the type of accidents in figure 4(a) and figure 4(b) is given in table 2. On Mondays and Wednesdays, the type of accidents in places where accidents are concentrated were tried to be analysed by adding the type of accidents given in table 2 to the obtained Kernel Density maps. The colour indications of the accident type label have been changed accordingly on Monday and Wednesday due to the fact that the colours cannot be seen clearly due to the differences in the locations where the accidents are intense. In addition, it was observed that there was no 7th type of accident in the accidents on Wednesday.
Table 6. Table of variance in the model established to determine whether there is a day effect on accidents.
|
Model
|
Sum of Squares
|
Degrees of Freedom
|
Mean Square
|
F
|
Significance Level
|
|
Regression
|
8.193
|
6
|
1.365
|
0.998
|
0.425
|
|
Residual
|
3986.782
|
2915
|
1.368
|
-
|
-
|
|
Total
|
3994.975
|
2921
|
-
|
-
|
-
|
Table 6 examines whether the model is significant as a whole. It was concluded that the model was not significant.
As modelling techniques, firstly, decision trees, artificial neural networks, logistic regression and Naive Bayes models were established in the whole Şişli district and the results were examined.
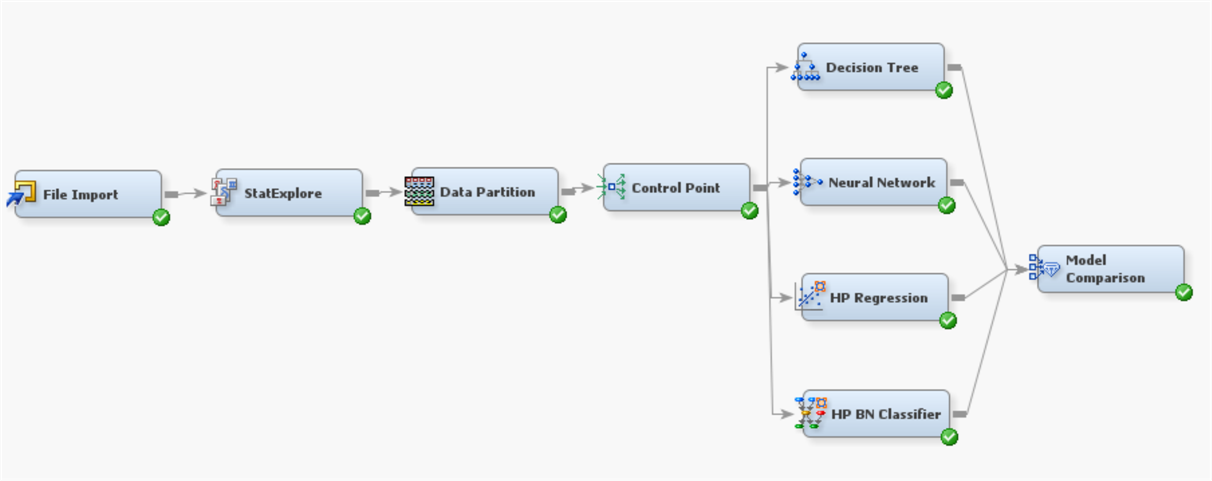
Figure 5. SAS Enterprise Miner interface demonstration.
In figure 5, the interface of the SAS Enterprise Miner software, where the application is made, is given.
Since the missing data were excluded from the analysis during the creation of the data set, it was seen that there was no amount of missing data. It has been observed that the kurtosis value obtained is at a normal level and there is no need to transform this variable. After these processes, the training, testing and validity rates of the models to be used were selected. As a result of various trials, it was decided to select the ratios of training, validity and test set as 60%, 30% and 10%, respectively.
Table 7. Model comparison fit statistics.
|
Model
|
Accuracy Rate
|
Error Rate
|
Roc Value
|
|
|
Training
|
Validity
|
Test
|
Training
|
Validity
|
Test
|
Training
|
Validity
|
Test
|
|
Decision Trees
|
0.99
|
0.99
|
0.99
|
0.01
|
0.01
|
0.01
|
0.99
|
0.48
|
0.476
|
|
Artificial Neural Networks
|
0.99
|
0.99
|
0.99
|
0.01
|
0.01
|
0.01
|
0.97
|
0.67
|
0.325
|
|
Logistic Regression
|
0.99
|
0.99
|
0.99
|
0.01
|
0.01
|
0.01
|
0.98
|
0.67
|
0.445
|
|
Naive Bayes
|
0,82
|
0.84
|
0.831
|
0.18
|
0.16
|
0.169
|
0.85
|
0.83
|
0.405
|
|
|
|
|
|
|
|
|
|
|
|
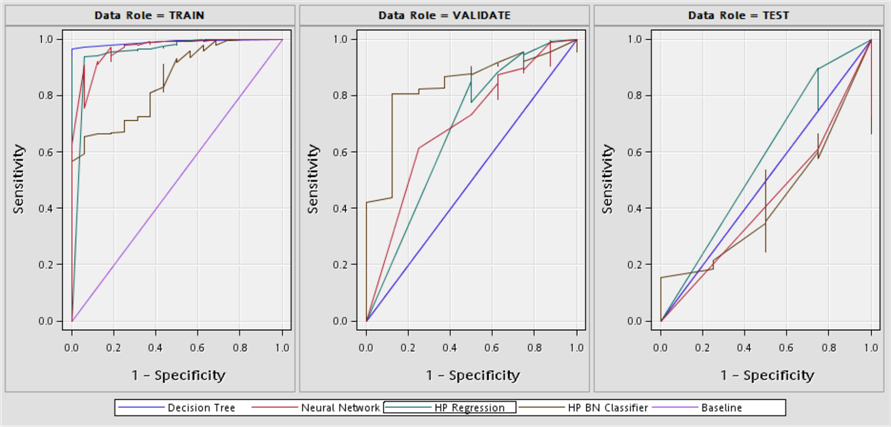
When we compare the accidents in Şişli district, according to accuracy and error rates in table 7; it has been seen that all methods except Naive Bayes give successful results in training accuracy, training error, validity accuracy, validation error, test accuracy and test error rates. When we make a comparison, according to ROC values, it is seen that the decision trees method according to the training ROC value, the Naive Bayes method according to the validity ROC value and the decision tree method according to the test ROC value are more successful than the other methods. When we make a general comparison, it is seen that the decision tree method gives more successful results than other methods in comparison criteria.
In figure 6, ROC curves of all accidents in Şişli district are given according to all models. The area under the curve shows the accuracy rate of accidents that resulted in fatal or injury. The area under the curve represents the ROC values. The baseline curve in the ROC curve comparison chart represents a model without predictive power. The predictive power of the curve is as it approaches the ideal point where the specificity value is 0 and the sensitivity value is 1. Therefore, when compared with ROC value, the predictive power of the model is related to its closeness to 1.
In order to better see the legends and other elements that cannot be seen clearly on the big map, Şişli district is divided into 3 regions and a detailed analysis of these streets has been made.
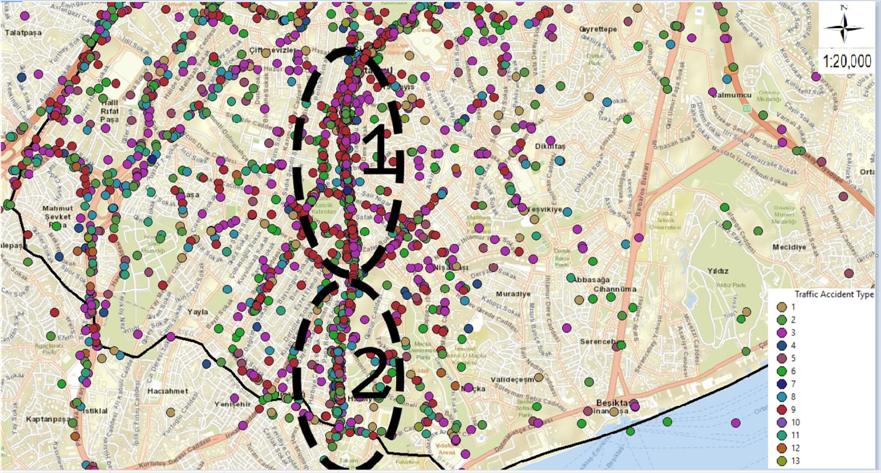
Figure 7. Representation of the 2 separated regions of traffic accidents in Şişli district.
Figure 7 shows the division of the parts of Şişli district outside of Büyükdere Street into regions. The separation of Büyükdere Street was also examined as the 3rd region. The decomposition is as follows;
3.1.1 Halaskargazi Street Results
|
(a)
|
(b)
|
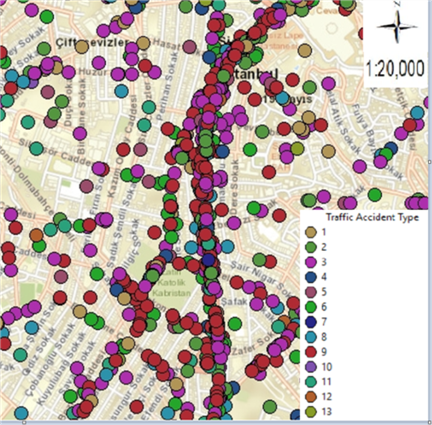
Figure 8. Maps of traffic accidents on Halaskargazi Street in Şişli district: (a) Thematic accident map by type of accident; (b) Kernel Density method map.
In figure 8, maps of a total of 289 fatal and injured traffic accidents that occurred between 2010-2017 on Halaskargazi Street in the Şişli district are given. The thematic accident map according to the type of accident is given in figure 8 (a) and the Kernel Density method map is given in figure 8 (b).
Thus, Halaskargazi Street, where the intensity of the accidents cannot be clearly understood on all Şişli maps, is better understood with the decomposed maps provided. It has been seen that the places where the accidents are intense in the Şişli Halaskargazi Street are the streets leading to Istanbul Şişli Hamidiye Etfal Training and Research Hospital and the Istanbul Provincial Directorate of the Turkish Social Security Institution Şişli Security Center. In this street, it has been determined that the pedestrian line is incorrect at the points where the accident density is determined and therefore, the accidents that occur in the form of hitting the pedestrian are high.
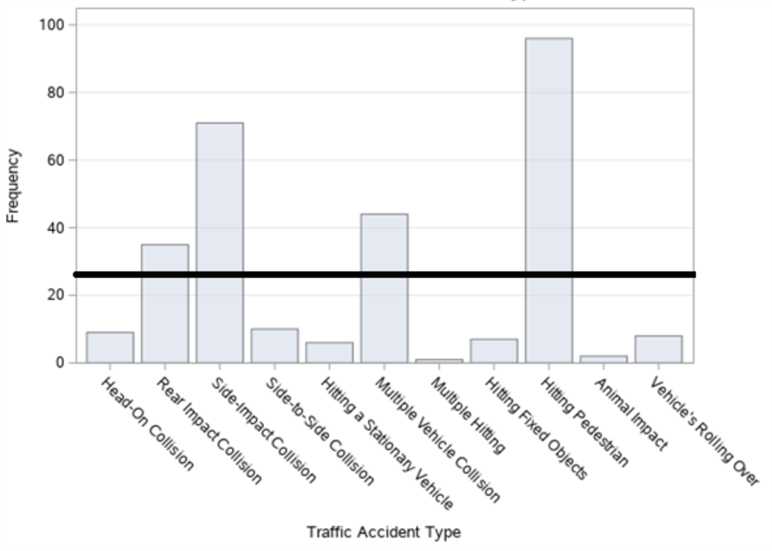
Figure 9. Bar graph of traffic accidents on Halaskargazi Street in Şişli district by accident type.
When the thematic accident map according to the type of accidents in figure 8 (a) and the bar graph made for the type of accidents in figure 9 are examined, it is seen that the accidents occurred in the form of hitting the pedestrian the most, followed by the accidents that occurred in the form of side impact collision.
Figure 10. Bar graphs of traffic accidents on Halaskargazi Street in Şişli district: (a) By years; (b) By months; (c) By days; (d) By time zones.
In figure 10, the bar graphs of the number of accidents by years, months, days and time zones, respectively, of a total of 289 fatal and injury traffic accidents that occurred on Halaskargazi Street in Şişli district between 2010 and 2017 are given. When we examine it according to the years in figure 10 (a), it is seen that the highest number of accidents occurred in 2016 with 48 accidents and the least accident occurred in 2017 with 23 accidents. When we examine the figures according to the months in figure 10 (b), it is observed that the highest number of accidents occurred in September with 35 accidents and the least accident occurred in April with 17 accidents. When we analyse it according to days in figure 10 (c), it is concluded that the highest number of accidents occurred on Thursday with 50 accidents and the least number of accidents occurred on Tuesdays and Wednesdays with 32 accidents. When we examine these accidents, according to the time zones in figure 10 (d), it is understood that the highest number of accidents occurred between 16:00 and 20:00 with 64 accidents and the least number of accidents occurred between 04:00 and 08:00 with 35 accidents.
As we have examined all the accidents in Şişli district, the accidents that occurred in Halaskargazi Street were also examined to investigate the effect of the day of the week. The data entered in the excel table of the accidents and the statistical model equations used were made as in all the accidents in Şişli district.
Table 8. Table of coefficients in the model established to determine whether there is a day effect on accidents.
|
|
Unstandardized Coefficients
|
Standard Coefficients
|
|
|
|
Model
|
B
|
Standard Error
|
Beta
|
t
|
Significance Level
|
|
Constant
|
0.120
|
0.016
|
|
7.691
|
0.000***
|
|
Tuesday
|
-0.043
|
0.022
|
-0.047
|
-1.958
|
0.050**
|
|
Wednesday
|
-0.043
|
0.022
|
-0.047
|
-1.958
|
0.050**
|
|
Thursday
|
2.140E-15
|
0.022
|
0.000
|
0.000
|
1.000
|
|
Friday
|
-0.003
|
0.022
|
-0.003
|
-0.122
|
0.903
|
|
Saturday
|
-0.027
|
0.022
|
-0.029
|
-1.207
|
0.227
|
|
Sunday
|
-0.031
|
0.022
|
-0.035
|
-1.424
|
0.154
|
|
|
|
|
|
|
|
*** 1% significance level
** 5% significance level
Table 8 shows (***) 1% significance level, (**) 5% significance level. During the day-based significance study, it was observed that Tuesday and Wednesday were different from other days in terms of the number of accidents at the 5% significance level. It was observed that the other days except Tuesday and Wednesday did not have a significant day effect, with Monday as the base day. The constant was found to be statistically significant at the 1% significance level. This indicates that Monday has a significant day effect. By frequency analysis, the accident causes of the days showing anomaly on this street were trying to be investigated. It was observed that in the accidents on Halaskargazi Street on Monday, there were 15 accidents in the form of side collisions, followed by hitting the pedestrian with 14 accidents. When we examine the side impact accidents on Monday, according to vehicle types, it has been observed that the most accidents are made by motorcycle vehicles, and in accidents that occur in the form of pedestrian collisions, it is observed that the most accidents are made by automobile vehicles. When the accidents on Tuesday were examined, it was seen that the highest number of accidents occurred in the form of hitting the pedestrian with 12 accidents, followed by the accidents in the form of multiple vehicle collisions with 6 accidents. When we analysed the pedestrian crashes that occurred on Tuesday, according to vehicle types, it was found that the highest number of accidents was made by automobiles. In the multiple vehicle collisions that occurred on Tuesday, it was understood that most accidents were caused by motorcycle vehicles. When the accidents in Halaskargazi Street on Wednesday were examined, it was seen that the highest number of accidents was pedestrian collisions with 12 accidents, followed by side collisions with 6 accidents. It was concluded that pedestrian collision accidents that occurred on Wednesday were mostly caused by motorcycles and automobiles. It was found that the accidents in the form of a side-impact collision on Wednesday were mostly caused by motorcycles.
Table 9. Table of variance in the model established to determine whether there is a day effect on accidents.
|
Model
|
Sum of Squares
|
Degrees of Freedom
|
Mean Square
|
F
|
Significance Level
|
|
Regression
|
0.976
|
6
|
0.163
|
1.605
|
0.142
|
|
Residual
|
295.440
|
2915
|
0.101
|
-
|
-
|
|
Total
|
296.416
|
2921
|
-
|
-
|
-
|
Table 9 examines whether the model is significant as a whole. It was concluded that the model was not significant.
Decision trees, artificial neural networks, logistic regression and Naive Bayes models were established in Halaskargazi Street and the results were examined.
Table 10. Model comparison fit statistics.
|
Model
|
Accuracy Rate
|
Error Rate
|
Roc Value
|
|
|
Training
|
Validity
|
Test
|
Training
|
Validity
|
Test
|
Training
|
Validity
|
Test
|
|
Decision Trees
|
0.994
|
1.000
|
1.000
|
0.006
|
0.000
|
0.000
|
0.971
|
-
|
-
|
|
Artificial Neural Networks
|
1.000
|
1.000
|
0.933
|
0.00
|
0.000
|
0.067
|
1.000
|
-
|
-
|
|
Logistic Regression
|
1.000
|
1.000
|
1.000
|
0.00
|
0.000
|
0.000
|
1.000
|
-
|
-
|
|
Naive Bayes
|
0.740
|
0.663
|
0.767
|
0.260
|
0.337
|
0.233
|
0.869
|
-
|
-
|
|
|
|
|
|
|
|
|
|
|
|
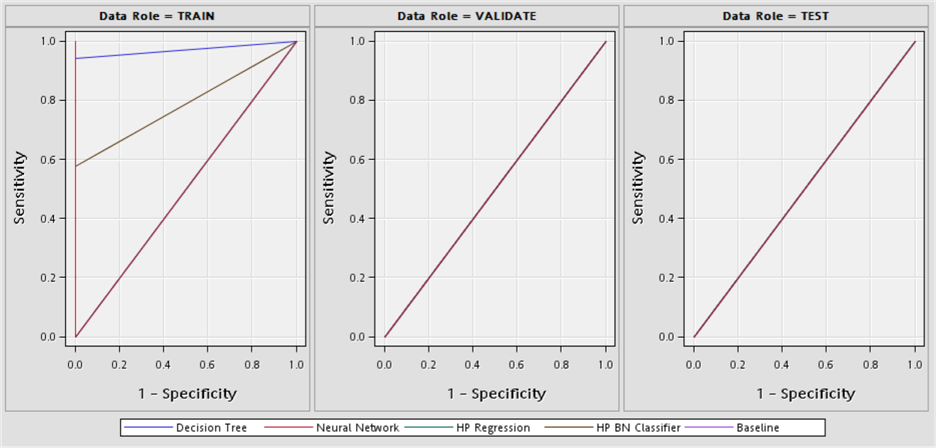
When we compare the accidents in the Şişli Halaskargazi Street according to accuracy and error rates in table 10; it has been seen that artificial neural networks and logistic regression methods in training accuracy and training error rates, all methods except Naive Bayes in validity, accuracy and validation error rates, decision trees and logistic regression methods in test accuracy and test error rates. When we make a comparison, according to the ROC values, it was seen that only the training ROC values were calculated due to the scarcity of data. It has been observed that artificial neural networks and logistic regression methods give successful results according to the training ROC values. When we make a general comparison, it was found that the logistic regression method gave better results than other methods in all comparison criteria.
In figure 11, ROC curves of the accidents in Halaskargazi Street are given according to all models. The area under the curve shows the accuracy rate of accidents that resulted in fatal or injury. The area under the curve represents the ROC index values.
3.1.2 Cumhuriyet Street Results
|
(a)
|
(b)
|
Figure 12. Maps of traffic accidents on Cumhuriyet Street in Şişli district: (a) Thematic accident map by type of accident; (b) Kernel Density method map.
In figure 12, maps of a total of 147 fatal and injured traffic accidents that occurred between 2010-2017 on Cumhuriyet Street in Şişli district are given. The thematic accident map according to the type of accident is given in figure 12 (a), and the Kernel Density method map is given in figure 12 (b).
Thus, the density of accidents cannot be clearly understood on all Şişli maps, and Cumhuriyet Street is better understood with the decomposed maps provided. It has been observed that the places where the accidents are intense in the Şişli Cumhuriyet Street are in the streets leading to the Istanbul Lütfi Kırdar International Convention and Exhibition Center, Istanbul Congress Center, Cemil Topuzlu Open Air Theatre and the Hilton Istanbul Bosphorus hotel. It is thought that accidents can be prevented by increasing pedestrian safety around the venues where the events are held.
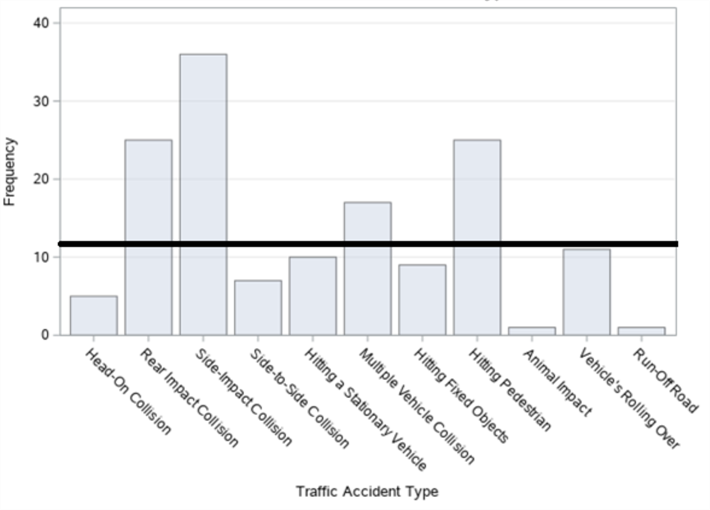
Figure 13. Bar graph of traffic accidents on Cumhuriyet Street in Şişli district by accident type.
When the thematic accident map according to the type of accidents in figure 12 (a) and the bar graph made for the type of accidents in figure 13 are examined, it is seen that the accidents occurred in the form of side-impact collision the most, followed by the accidents that occurred in the form of rear-impact collision and hitting the pedestrian.
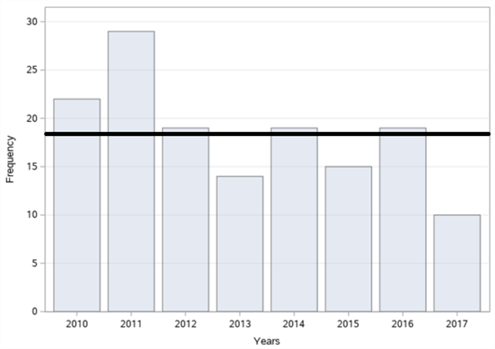
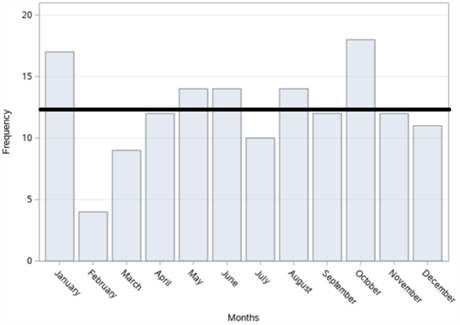
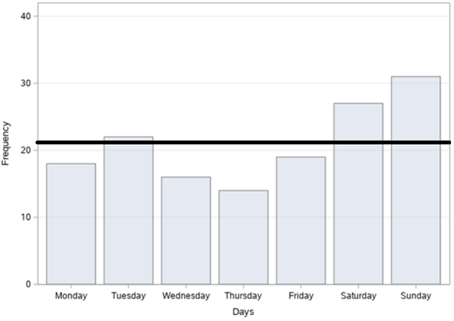
Figure 14. Bar graphs of traffic accidents on Cumhuriyet Street in Şişli district: (a) By years; (b) By months; (c) By days; (d) By time zones.
In figure 14, the bar graphs of the number of accidents according to years, months, days and time zones, respectively, of a total of 147 fatal and injury traffic accidents that occurred on Cumhuriyet Street in Şişli district between 2010-2017 are given. When we examine it according to the years in figure 14 (a), it is seen that the highest number of accidents occurred in 2011 with 29 accidents and the least accident occurred in 2017 with 10 accidents. When we analyse the figure 14 (b) by months, it is observed that the highest number of accidents occurred in October with 18 accidents and the least accident occurred in February with 4 accidents. When we examine it according to the days in figure 14 (c), it is understood that the highest number of accidents occurred on Sunday with 31 accidents and the least accident occurred on Thursday with 14 accidents. When we examine these accidents, according to the time zones in figure 14 (d), it is concluded that the highest number of accidents occurred between 04:00 and 08:00 with 33 accidents and the least number of accidents occurred between 20:00 and 24:00 with 16 accidents.
As we have examined all the accidents in the Şişli district, the accidents that occurred on Cumhuriyet Street were also examined to investigate the effect on the day of the week. The data entered in the excel table of the accidents and the statistical model equations used were made as in all the accidents in the Şişli district.
Table 11. Table of coefficients in the model established to determine whether there is a day effect on accidents.
|
|
Unstandardized Coefficients
|
Standard Coefficients
|
|
|
|
Model
|
B
|
Standard Error
|
Beta
|
t
|
Significance Level
|
|
Constant
|
0.043
|
0.011
|
|
3.773
|
0.000***
|
|
Tuesday
|
0.010
|
0.016
|
0.014
|
0.593
|
0.553
|
|
Wednesday
|
-0.005
|
0.016
|
-0.007
|
-0.296
|
0.767
|
|
Thursday
|
-0.010
|
0.016
|
-0.014
|
-0.593
|
0.553
|
|
Friday
|
0.002
|
0.016
|
0.003
|
0.142
|
0.887
|
|
Saturday
|
0.021
|
0.016
|
0.032
|
1.325
|
0.185
|
|
Sunday
|
0.031
|
0.016
|
0.046
|
1.917
|
0.055*
|
|
|
|
|
|
|
|
*** 1% significance level
* 10% significance level
Table 11 shows (***) 1% significance level, (*) 10% significance level. During the day-based significance research, it was observed that Sunday was different from other days in terms of the number of accidents at the 10% significance level. It has been observed that the other days, except Sunday, do not have a significant day effect, provided that Monday is taken as the base day. The constant was found to be statistically significant at the 1% significance level. This indicates that Monday has a significant day effect. By frequency analysis, the accident causes of the days showing anomaly on this street were trying to be investigated. It was observed that in the accidents that took place on Cumhuriyet Street on Monday, the highest number of accidents was a rear-impact collision with 5 accidents, followed by side-to-side collisions with 4 accidents. It was found that most of the rear impact and side-impact collisions on Monday were caused by automobiles. When the accidents on Sunday on Cumhuriyet Street were examined, it was observed that the highest number of accidents was in the form of rear-impact collisions with 7 accidents, followed by pedestrian collisions and vehicles rolling over equally with 5 accidents. It was concluded that the rear impact collisions on Sunday were mostly made by automobiles, and hitting the pedestrian were equally made by motorcycles and automobiles. On the other hand, it was observed that the accidents that occurred in the form of a vehicle rolling over on Sunday were mostly caused by automobiles.
Table 12. Table of variance in the model established to determine whether there is a day effect on accidents.
|
Model
|
Sum of Squares
|
Degrees of Freedom
|
Mean Square
|
F
|
Significance Level
|
|
Regression
|
0.533
|
6
|
0.089
|
1.628
|
0.135
|
|
Residual
|
159.072
|
2915
|
0.055
|
-
|
-
|
|
Total
|
159.605
|
2921
|
-
|
-
|
-
|
Table 12 examines whether the model is significant as a whole. It was concluded that the model was not significant.
Secondly, decision trees, artificial neural networks, logistic regression and Naive Bayes models were established on Cumhuriyet Street and the results were examined.
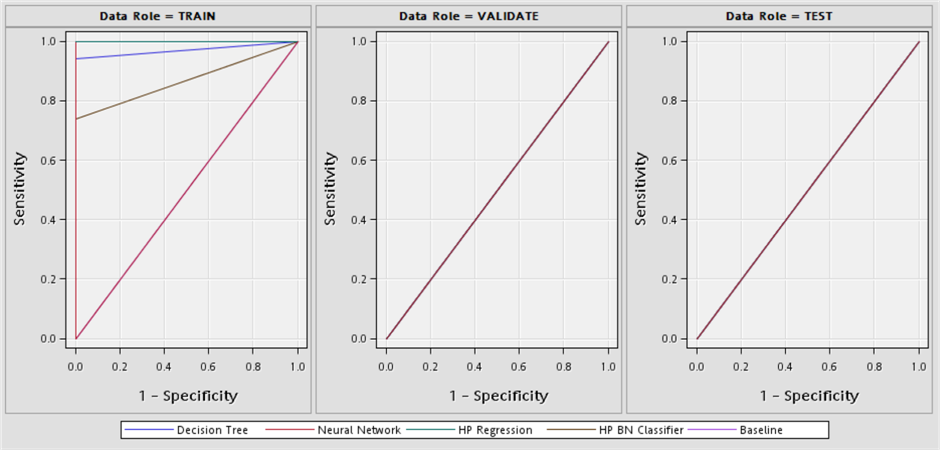
Table 13. Model comparison fit statistics.
|
Model
|
Accuracy Rate
|
Error Rate
|
Roc Value
|
|
|
Training
|
Validity
|
Test
|
Training
|
Validity
|
Test
|
Training
|
Validity
|
Test
|
|
Decision Trees
|
0.989
|
1.000
|
1.000
|
0.011
|
0.000
|
0.000
|
0.971
|
-
|
-
|
|
Artificial Neural Networks
|
1.000
|
1.000
|
1.000
|
0.000
|
0.000
|
0.000
|
1.000
|
-
|
-
|
|
Logistic Regression
|
1.000
|
1.000
|
1.000
|
0.000
|
0.000
|
0.000
|
1.000
|
-
|
-
|
|
Naive Bayes
|
0.943
|
1.000
|
0.933
|
0.057
|
0.000
|
0.067
|
1.000
|
-
|
-
|
|
|
|
|
|
|
|
|
|
|
|
When we compare the accidents in the Şişli Cumhuriyet Street according to accuracy and error rates in table 13; it has been seen that artificial neural networks and logistic regression methods in training accuracy and training error rates, all methods in validity, accuracy and validity error rates, all methods except Naive Bayes in test accuracy and test error rates. When we make a comparison, according to the ROC values, it was seen that only the training ROC values were calculated due to the scarcity of data. According to the training ROC values, it was observed that other methods other than decision trees gave successful results. When we made a general comparison, it was found that artificial neural networks and logistic regression methods gave better results than other methods in all comparison criteria.
In figure 15, ROC curves of the accidents on Cumhuriyet Street are given according to all models. The area under the curve shows the accuracy rate of accidents that resulted in fatal or injury. The area under the curve represents the ROC index values.
3.1.3 Büyükdere Street Results
|
(a)
|
(b)
|
Figure 16. Maps of traffic accidents on Büyükdere Street in Şişli district: (a) Thematic accident map by type of accident; (b) Kernel Density method map.
In figure 16, maps of a total of 809 fatal and injured traffic accidents that occurred between 2010-2017 on the Büyükdere Street in Şişli district are given. The thematic accident map according to the type of accident is given in figure 16 (a) and the Kernel Density method map is given in figure 16 (b).
Thus, Büyükdere Street, where the intensity of the accidents cannot be clearly understood on all Şişli maps, is better understood with the decomposed maps provided. It has been observed that the points where the accidents are intense in Şişli Büyükdere Street are the places that lead from Garaj Street and Ortaklar Junction to Büyükdere Street. It has been observed that there has been a decrease in the number of accidents on this street only since 2015. When the reason for this is investigated, in 2015, in the Şişli-Mecidiyeköy direction of the Istanbul Metropolitan Municipality; it has been observed that the section of Büyükdere Street between Aytekin Kotil Street and Ortaklar Street has partial lane narrowest, giving vehicle traffic to 2 lanes, and creating a pedestrian passage corridor between the construction site and buildings, providing safe passage for pedestrians. Thus, after 2015, there has been a decrease in accidents that occur in the form of hitting pedestrians in this direction. In addition, in the Mecidiyeköy-Şişli direction, it provides vehicle traffic flow by giving it over Bahçeler Street (1 round-1 arrival) between Aytekin Kotil Street and Ortaklar Street, for vehicles continuing on Mecidiyeköy Road Street, the Connection Road under the D-100 Highway and first Geçit Street and the works carried out to enable them to reach Şişli side from Büyükdere Street by proceeding from Abide-i Hürriyet Street and the traffic light arrangement on the Büyükdere Street connection section of Aytekin Kotil Street and the work done to ensure the participation of vehicles in the Şişli direction was effective in reducing traffic accidents. It is thought that there will be a decrease in accidents as a result of the correction of the negativities detected in this study.
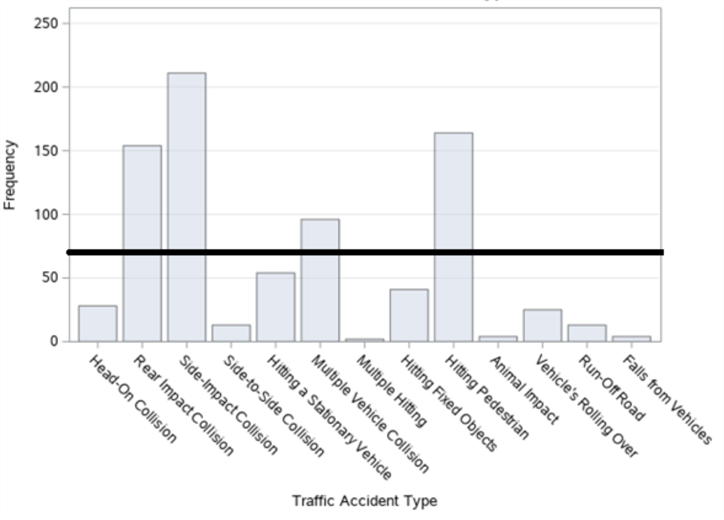
Figure 17. Bar graph of traffic accidents on Büyükdere Street in Şişli district by accident type.
When the thematic accident map according to the type of accidents in figure 16 (a) and the bar graph made for the type of accidents in figure 17 is examined, it is seen that the accidents occurred in the form of side-impact collision the most, followed by the accidents that occurred in the form of hitting the pedestrian.
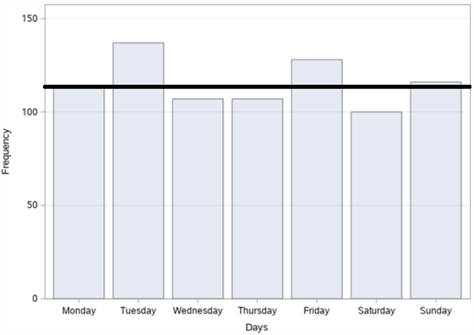
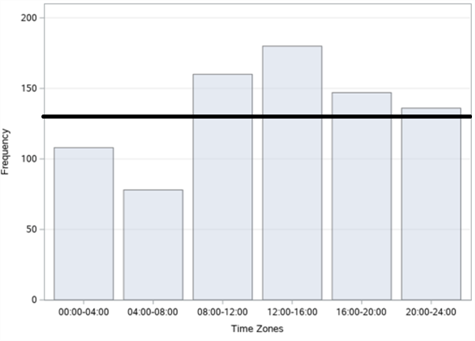
Figure 18. Bar graphs of traffic accidents on Büyükdere Street in Şişli district: (a) By years; (b) By months; (c) By days; (d) By time zones.
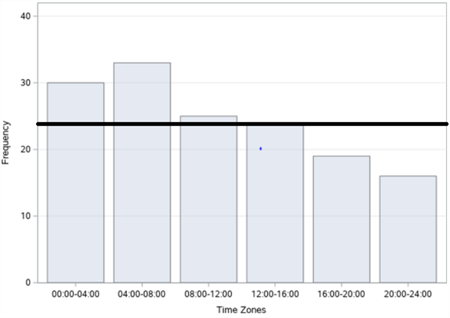
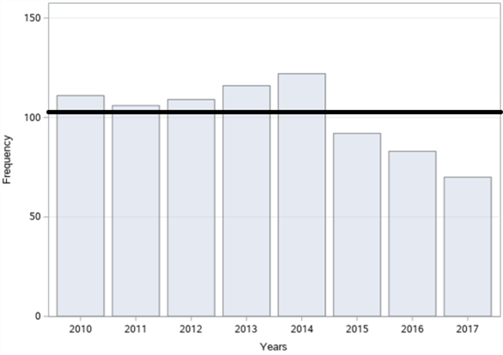
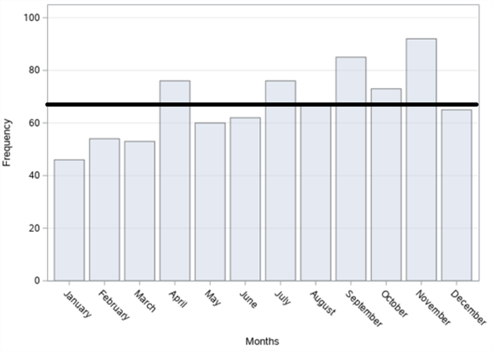
In figure 18, the bar graphs of the number of accidents according to years, months, days and time zones, respectively, of a total of 809 fatal and injury traffic accidents that occurred on Büyükdere Street in Şişli district between 2010-2017 are given. When we examine it according to the years in figure 18 (a), it is seen that the highest number of accidents was in 2014 with 122 accidents and the least accident was in 2017 with 70 accidents. When we examine the figures according to the months in figure 18 (b), it is observed that the highest number of accidents occurred in November with 92 accidents and the least accident occurred in January with 46 accidents. When we examine it according to the days in figure 18 (c), it is understood that the highest number of accidents occurred on Tuesday with 137 accidents, and the least number of accidents occurred on Saturday with 100 accidents. When we examine these accidents according to the time zones in figure 18 (d), it is concluded that the highest number of accidents occurred between 12:00 and 16:00 with 180 accidents and the least number of accidents occurred between 04:00 and 08:00 with 78 accidents.
As we have examined all the accidents in Şişli district, the accidents that occurred in Büyükdere Street were also examined to investigate the effect of the day of the week. The data entry in the excel table of the accidents and the statistical model equations used were made as in all the accidents in Şişli district.
Table 14. Table of coefficients in the model established to determine whether there is a day effect on accidents.
|
|
Unstandardized Coefficients
|
Standard Coefficients
|
|
|
|
Model
|
B
|
Standard Error
|
Beta
|
t
|
Significance Level
|
|
Constant
|
0.271
|
0.026
|
|
10.465
|
0.000***
|
|
Tuesday
|
0.050
|
0.037
|
0.033
|
1.375
|
0.169
|
|
Wednesday
|
-0.007
|
0.037
|
-0.005
|
-0.196
|
0.844
|
|
Thursday
|
-0.012
|
0.037
|
-0.008
|
-0.327
|
0.743
|
|
Friday
|
0.035
|
0.037
|
0.023
|
0.963
|
0.336
|
|
Saturday
|
-0.032
|
0.037
|
-0.021
|
-0.868
|
0.386
|
|
Sunday
|
0.007
|
0.037
|
0.004
|
0.178
|
0.858
|
|
|
|
|
|
|
|
*** 1% significance level
Table 14 shows (***) 1% significance level. During the day-based significance survey, it was seen that there was no significant day effect on any day provided that Monday was taken as the basic day. Constant was found to be statistically significant at the 1% significance level. This means that Monday has a meaningful day effect. With the frequency analysis, the causes of accidents of the days showing anomalies on this street were trying to be investigated. When the accidents on Büyükdere Street on Monday are examined, it is seen that the highest number of accidents is side-impact collisions with 29 accidents and hitting the pedestrian with 27 accidents. It was found that the accidents in the form of a side-impact collision and hitting the pedestrian on Monday were mostly caused by automobiles.
Table 15. Table of variance in the model established to determine whether there is a day effect on accidents.
|
Model
|
Sum of Squares
|
Degrees of Freedom
|
Mean Square
|
F
|
Significance Level
|
|
Regression
|
1.996
|
6
|
0.333
|
1.190
|
0.308
|
|
Residual
|
815.020
|
2915
|
0.280
|
-
|
-
|
|
Total
|
817.016
|
2921
|
-
|
-
|
-
|
Table 15 examines whether the model is significant as a whole. It was concluded that the model was not significant.
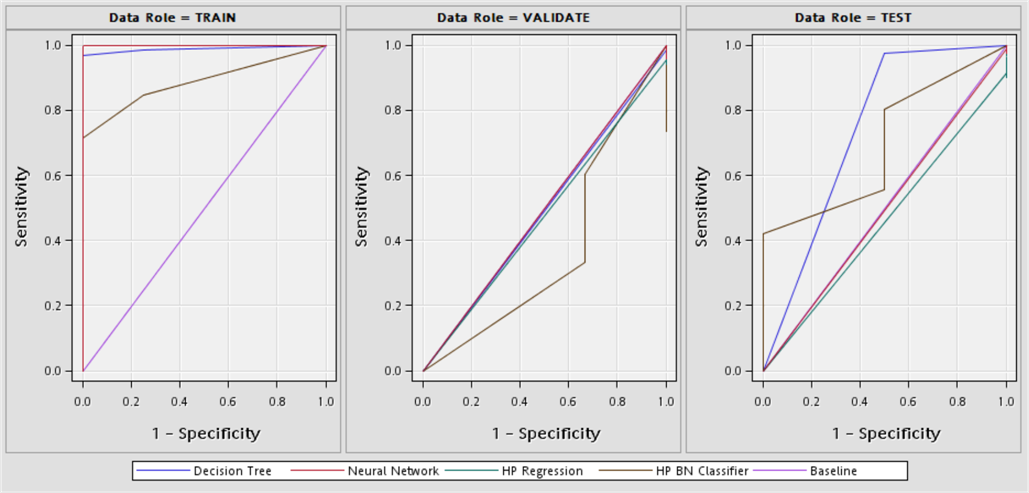
Finally, decision trees, artificial neural networks, logistic regression and Naive Bayes models were established on Büyükdere Street and the results were examined.
Table 16. Model comparison fit statistics.
|
Model
|
Accuracy Rate
|
Error Rate
|
Roc Value
|
|
|
Training
|
Validity
|
Test
|
Training
|
Validity
|
Test
|
Training
|
Validity
|
Test
|
|
Decision Trees
|
0.992
|
0.988
|
0.976
|
0.008
|
0.012
|
0.024
|
0.989
|
0.492
|
0.738
|
|
Artificial Neural Networks
|
1.000
|
0.988
|
0.964
|
0.000
|
0.012
|
0.036
|
1.000
|
0.353
|
0.670
|
|
Logistic Regression
|
1.000
|
0.955
|
0.916
|
0.000
|
0.045
|
0.084
|
1.000
|
0.400
|
0.401
|
|
Naive Bayes
|
0.718
|
0.724
|
0.627
|
0.282
|
0.276
|
0.373
|
0.887
|
0.334
|
0.694
|
|
|
|
|
|
|
|
|
|
|
|
When we compare the accidents in Şişli Büyükdere Street, according to accuracy and error rates in table 16; it has been seen that artificial neural networks and logistic regression methods in training accuracy and training error rates, decision trees and artificial neural network methods in validity, accuracy and validity error rates and decision tree methods in test accuracy and test error rates are more successful than other methods. When we compare according to ROC values, artificial neural networks and logistic regression methods according to training ROC values, the decision tree method according to validity ROC values and when we compared according to test ROC values, it is observed that the decision trees method gives more successful results than other methods. When we make a general comparison, it is seen that the decision tree method gives more successful results than other methods in comparison criteria.
In figure 19, ROC curves of the accidents on Büyükdere Street are given according to all models. The area under the curve shows the accuracy rate of accidents that resulted in fatal or injury. The area under the curve represents the ROC index values.
4 . Discussion
It is very important to make decisions based on data to follow and control traffic accidents. For this reason, the method of detecting anomalies with the day of the week effect approach, which is known in the field of finance, has been adapted to traffic accidents. Determining the days that differ from the anomaly detection in traffic accidents can enable faster measures to be taken for the incidents that cause the accidents (Örnek, Vatan, Sarıoğlu, & Yazıcı, 2018).
In this study, the streets with high traffic accidents were determined by the Kernel Density method and then the days when the accidents showed anomalies on these streets were determined. Thus, it is thought that the units trying to prevent traffic accidents can take the necessary measures in a narrower area, according to the causes of the accident by examining the days when the accidents show an anomaly in different locations according to the changing conditions. This will also save cost and time.
Since the database of the General Directorate of Security has only data on fatal and injury accidents, data on accidents with material damage could not be obtained. However, the fact that the data we requested from the Insurance Information and Monitoring Centre could not be obtained partially negatively affected this study to be carried out in more detail.
In this study, the accident coordinates obtained from the General Directorate of Security were used in the spatial analysis in the Kernel Density method. The Kernel Density method was preferred because it gives better results visually than other spatial methods in the studies carried out to determine accident densities. In this study, it has been seen that it is more efficient in terms of results to include narrowed location-based analysis instead of studies that will take all of the regional data in our spatial analysis.
For this reason, it has been seen that it will be more effective to reduce the accidents by examining the regions where the accidents are intense with frequency analysis and anomaly approach, and offering solutions if possible. In addition, classification methods are emphasized by using traffic accident data in these regions. The success of the models according to the regions was evaluated by applying various ML methods in classifying the results of traffic accidents as fatal and injury. For this, decision trees, artificial neural networks, logistic regression and Naive Bayes models were tried to observe the differences in the results according to the streets where the accidents were intense. The main purpose of developing the models according to different locations is to help reduce accidents by deciding on the most appropriate model in a more restricted area in classifying the result of traffic accidents as fatal and injury accidents. As a result, it was concluded that although the examined models showed high performance, they showed differences according to the locations where the accidents occurred.
5 . Conclusions
It is important to investigate the cause of the accidents that occurred in the same location in order to reduce traffic accidents and ensure the life safety of people. To take effective measures regarding road safety, it is necessary to determine and analyse the regions where the accidents are concentrated. With the locational determination of the black spots, the factors causing the accidents should be investigated.
When the integrated density maps of the Şişli district were examined, it was decided to examine the district separately as 3 separate regions. Among the spatial methods, the Kernel Density method was preferred because its vitality is better. With this method and statistical analysis, firstly the determined regions were analysed and then the effect on the day of the week for traffic accidents in these determined regions was investigated and the days showing anomalies were evaluated according to the regions. During the day-based significance research on death and injury accidents in the whole Şişli district between 2010 and 2017, it was seen that Wednesday was different from other days in terms of accident numbers at the 10% significance level. In the analysis made separately according to the streets, it was seen that Tuesday and Wednesday were different from other days in terms of the number of accidents at the 5% significance level, in the day-based significance research of the fatal and injury accidents that occurred between 2010-2017 on Halaskargazi Street. Secondly, it was observed that Sunday was different from other days in terms of the number of accidents at the 10% significance level, in the day-based significance study of fatal and injury accidents that occurred on Cumhuriyet Street between 2010-2017. Finally, in the day-based significance research of fatal and injury accidents that occurred on Büyükdere Street, it was concluded that there was no significant day effect on any day, based on Monday.
In this study, decision trees, artificial neural networks, logistic regression and Naive Bayes models were established as modelling techniques and the performance of the methods in classifying the target variable as fatal and injury accidents was compared according to accuracy, error rates and ROC values for these streets. In this way, it was ensured that a possible accident in the future would result in death or injury and assisted the relevant units in the measures to be taken. Model building studies were also carried out in terms of other target variables. A successful model could not be obtained in model studies with variables such as target variable accident occurrence type and vehicle type. It was concluded that these target variables are completely random and cannot be predicted within the framework of classification models. In the results obtained, the success of different classification techniques [decision tree for the whole Şişli (Table 7), logistic regression for Halaskargazi Street (Table 10), artificial neural networks and logistic regression for Cumhuriyet Street (Table 13) and decision tree for Büyükdere Street (Table 16)] is due to the structure of the existing data and it is possible for the results to change according to a different data set.
This study has shown that necessary measures should be taken by examining a narrower area with the help of spatial analysis in the prevention of fatal and injury accidents. It has been seen that the place examined with the help of statistical analysis of the entire Şişli district is not very effective in taking measures to reduce accidents. For this reason, with this study, which is a guide for the units trying to prevent traffic accidents, it has been seen that the researches made by dividing into regions and using the differentiated analysis give more realistic results for the solution proposals to be produced. This study predicts that making arrangements to take into account the types of vehicles involved in accidents in certain locations together with the day effect will be more effective in reducing fatal and injury accidents. It is thought that the application of a known method in the field of finance in terms of traffic accidents will provide a new perspective for future studies.
Acknowledgements
We would like to thank the General Directorate of Security for providing the data they have for the completion of this study. We would also like to thank the 100/2000 YÖK doctoral scholarship program.
Conflicts of interest
The Author(s) declare(s) that there is no conflict of interest.
Data availability statement
The original contributions presented in the study are included in the article/supplementary material, further inquiries can be directed to the corresponding author/s.
Ethics statements
Studies involving animal subjects: No animal studies are presented in this manuscript.
Studies involving human subjects: No human studies are presented in this manuscript.
Inclusion of identifiable human data: No potentially identifiable human images or data is presented in this study.
CRediT authorship contribution statement
Conceptualization: M.E., A.H.B., S.E.T. Data curation: M.E., A.H.B., S.E.T. Formal analysis: M.E., A.H.B., S.E.T. Investigation: M.E., A.H.B., S.E.T. Methodology: M.E., A.H.B., S.E.T. Project administration: M.E., A.H.B., S.E.T. Writing—original draft: M.E., A.H.B., S.E.T. Writing—review and editing: M.E., A.H.B., S.E.T. All authors have read and agreed to the published version of the manuscript.
References
Aharon, D. Y., & Qadan, M. (2019). Bitcoin and the day-of-the-week effect. Finance Research Letters, 31. https://doi.org/10.1016/j.frl.2018.12.004
Bayrak, E. A., & Kirci, P. (2019). Intelligent Big Data Analytics in Health. Early Detection of Neurological Disorders Using Machine Learning Systems (pp:252-291), IGI Global. https://doi.org/10.4018/978-1-5225-8567-1.ch014
Bil, M., Andrasik, R., & Janoska, Z. (2013). Identification of hazardous road locations of traffic accidents by means of kernel density estimation and cluster significance evaluation. Accident Analysis & Prevention, 55, 265-273. https://doi.org/10.1016/j.aap.2013.03.003.
Budak, H., & Erpolat, S. (2012). Kredi Risk Tahmininde Yapay Sinir Ağları ve Lojistik Regresyon Analizi Karşılaştırılması [Comparison of Artificial Neural Networks and Logistic Regression Analysis in the Credit Risk Prediction]. AJIT‐e: Online Academic Journal of Information Technology, 3(9), 23-30. https://doi.org/10.5824/1309-1581.2012.4.002.x
Camkesen, N., & Bayrakdar, Z. (1999). Alan Analizi Yöntemi ile Kazaların Gerçek Nedenlerinin Saptanması [Field Analysis Method Determining the Real Causes of Situations], II. Transportation and Traffic Congress Book of Proceedings, Ankara. Available Online:https://docplayer.biz.tr/25379493-Ii-ulasim-ve-trafik-kongresi-sergisi-bildiriler-kitabi.html (Accessed on: 02.12.2021).
Cengiz, H., Bilen, Ö., Büyüklü, A. H., & Damgacı, G. (2017). Stock market anomalies: the day of the week effects, evidence from Borsa Istanbul. Journal of Global Entrepreneurship Research, 7(4). https://doi.org/10.1186/s40497-017-0062-6
Chong, M., Abraham, A., & Paprzycki, M. (2005). Traffic accident analysis using machine learning paradigms. Informatica, 29(1), 89-98. https://www.informatica.si/index.php/informatica/article/view/21/15
Çalış, A., Kayapınar, S., & Çetinyokuş, T. (2014). Veri Madenciliğinde Karar Ağacı Algoritmaları ile Bilgisayar ve İnternet Güvenliği Üzerine Bir Uygulama [An Application on Computer and Internet Security with Decision Tree Algorithms in Data Mining]. Endüstri Mühendisliği Dergisi, 25(3), 2-19. https://dergipark.org.tr/tr/pub/endustrimuhendisligi/issue/46771/586362
Dereli, M. A., & Erdogan, S. (2017). A new model for determining the traffic accident black spots using GIS-aided spatial statistical methods. Transportation Research Part A: Policy and Practice, 103, 106-117. https://doi.org/10.1016/j.tra.2017.05.031
Duran, E. A., Pamukçu, A., & Bozkurt, H. (2014). Comparison of Data Mining Techniques for Direct Marketing Campaings. Sigma Journal of Engineering and Natural Sciences, 32, 142-152. https://sigma.yildiz.edu.tr/storage/upload/pdfs/1636023750-en.pdf
Emel, G. G., & Taşkın, Ç. (2005). Veri Madenciliğinde Karar Ağaçları ve Bir Satış Analizi Uygulaması [Decision Trees in Data Mining and a Sales Analysis Application]. Eskişehir Osmangazi Üniversitesi Sosyal Bilimler Dergisi, 6(2), 221-239. https://dergipark.org.tr/tr/pub/ogusbd/issue/10987/131495
Erdogan, S., Yılmaz, İ., Baybura, T., & Gullu, M. (2008). Geographical information systems aided traffic accident analysis system case study: city of Afyonkarahisar. Accident Analysis & Prevention, 40, 174–181. https://doi.org/10.1016/j.aap.2007.05.004
Ersen, M., Büyüklü, A. H., & Taşabat, S. E. (2021). Analysis of Fatal and Injury Traffic Accidents in Istanbul Sarıyer District with Spatial Statistics Methods. Sustainability. 13, 11039. https://doi.org/10.3390/su131911039
Evci, S. (2020). Bitcoin Piyasasında Haftanın Günü Anomalisi [The Day of the Week Anomaly in Bitcoin Market]. Alanya Akademik Bakış Dergisi, 4(1), 53-61. https://doi.org/10.29023/alanyaakademik.664776
Gujarati, D. N., & Porter, D. C. (2009). Basic Econometrics, 5th ed.; McGraw-Hill: New York, NY, USA.
Gündoğdu, G. (2010). Coğrafi Bilgi Teknolojileri Kullanılarak Trafik Kaza Analizi: Adana Örneği [Analysing the Traffic Accidents Using Geographical Information Technologies: Adana Case Study]. Master’s Thesis, Çukurova University, Graduate School of Science and Engineering, Department of Remote Sensing and Geographical Information Systems.
Khokale, R., & Ghate, A. (2017). Data Mining for Traffic Prediction and Analysis using Big Data. International Journal of Engineering Trends and Technology (IJETT), 48(3). https://doi.org/10.14445/22315381/IJETT-V48P227
Le, K. G., Liu, P., & Lin, L. T. (2019). Determining the road traffic accident hotspots using GIS-based temporal-spatial statistical analytic techniques in Hanoi, Vietnam. Geo-spatial Information Science, 23(6), 1-12. https://doi.org/10.1080/10095020.2019.1683437
Lin, L., Wang, Q., & Sadek, A. W. (2014). Data Mining and Complex NetworkAlgorithms for Traffic Accident Analysis. Transportation Research Record, 2460, 128-136. https://doi.org/10.3141/2460-14
Long, W. J., Griffith, J. L., Selker, H. P., & D'Agostino, R. B. (1993). A Comparison of Logistic Regression to Decision-Tree Induction in a Medical Domain. Computers and Biomedical Research, 26(1), 74-97. https://doi.org/10.1006/cbmr.1993.1005
Mohaymany, A. S., Shahri, M., & Mirbagheri, B. (2013). GIS-based method for detecting high-crash-risk road segments using network kernel density estimation. Geo-spatial Information Science, 16(2), 113-119. https://doi.org/10.1080/10095020.2013.766396
Olutayo, V. A., & Eludire, A. A. (2014). Traffic Accident Analysis Using Decision Trees and Neural Networks. I.J. Information Technology and Computer Science, 02, 22-28. https://doi.org/10.5815/ijitcs.2014.02.03
Orhan, A., Emikönel, M., & Emikönel, M. (2021). Volatility and the Day of the Week Effect on Bitcoin Returns. Journal Of Emerging Economies And Policy, 6(2), 51-58. https://dergipark.org.tr/tr/pub/joeep/issue/60720/905965
Orhan, U., & Adem, K. (2012). Naive Bayes Yönteminde Olasılık Çarpanlarının Etkileri [The Effects of Probability Factors in Naive Bayes Method]. Elektrik - Elektronik ve Bilgisayar Mühendisliği Sempozyumu, (s.723). Available Online: https://www.emo.org.tr/ekler/3896071e2f0ee60_ek.pdf (Accessed on: 05.12.2021).
Örnek, Ö., Vatan, S., Sarıoğlu, S., & Yazıcı, A. (2018). Trafik Ağlarında Anomali Tespiti [Anomaly Detection in Traffic Networks]. Eskişehir Osmangazi Üniversitesi Mühendislik ve Mimarlık Fakültesi Dergisi, 26(3), 132-138. https://doi.org/10.31796/ogummf.440285
Özden, C., & Acı, Ç. (2018). Makine öğrenmesi yöntemleri ile yaralamalı trafik kazalarının analizi: Adana örneği [Analysis of injury traffic accidents with machine learning methods: Adana case]. Pamukkale Üniversitesi Mühendislik Bilimleri Dergisi, 24(2), 266-275. https://doi.org/10.5505/pajes.2016.87847
Saplıoğlu, M., & Karaşahin, M. (2006). Coğrafi Bilgi Sistemi yardımı ile Isparta ili kent içi trafik kaza analizi [Urban Traffic Accident Analysis By Using Geographic Information System]. Pamukkale Üniversitesi Mühendislik Bilimleri Dergisi, 12(3), 321-332. https://dergipark.org.tr/tr/pub/pajes/issue/20521/218519
Singh, M., & Kaur, A. (2016). A Review on Road Accident in Traffic System using Data Mining Techniques. International Journal of Science and Research (IJSR), 5(1), 1530-1535. https://doi.org/10.21275/v5i1.nov153099
Şahin, M. (2018). Karar Ağaçları ve Yapay Sinir Ağları Kullanılarak Kasko Sigortalarında Risk Değerlendirme [Risk Assessment in Car Insurance Using Decision Trees and Artificial Neural Networks], Master’s Thesis, Yıldız Technical University, Graduate School of Science and Engineering, Department of Statistics.
Şen, K. (2014). Bankacılıkta Müşteri Terk Modeli [Customer Churn Modelling in Banking], Master’s Thesis, Yıldız Technical University, Graduate School of Science and Engineering, Department of Mathematical Engineering.
Thakali, L., Kwon, T. J., & Fu, L. (2015). Identification of crash hotspots using kernel density estimation and kriging methods: a comparison. Journal of Modern Transportation, 23, 93-106. https://doi.org/10.1007/s40534-015-0068-0
TURKSTAT. (2020). Highway Traffic Accident Statistics. Available Online: https://data.tuik.gov.tr/Bulten/Index?p=Road-Traffic-Accident-Statistics-2020-37436 (Accessed on: 05.12.2021).
Walsh, S. (2005). Applying Data Mining Techniques Using SAS® Enterprise Miner-Course Notes. North Carolina: SAS Institute Inc.
Xie, Z., & Yan, J. (2008). Kernel Density Estimation of traffic accidents in a network space. Computers, Environment and Urban Systems, 32(5), 396-406. https://doi.org/10.1016/j.compenvurbsys.2008.05.001
Xie, Z., & Yan, J. (2013). Detecting traffic accident clusters with network kernel density estimation and local spatial statistics: an integrated approach. Journal of Transport Geography, 31, 64-71. https://doi.org/10.1016/j.jtrangeo.2013.05.009
Yavuz, A. A., Ergül, B., & Aşık, E. G. (2021). Trafik Kazalarının Makine Öğrenmesi Yöntemleri Kullanılarak Değerlendirilmesi [Evaluation of Traffic Accidents Using Machine Learning Methods]. Uluslararası Mühendislik Araştırma ve Geliştirme Dergisi, 13(1), 66-73. https://doi.org/10.29137/umagd.705156
Yavuz, A., & Çilengiroğlu, Ö. V. (2020). Lojistik Regresyon ve CART Yöntemlerinin Tahmin Edici Performanslarının Yaşam Memnuniyeti Verileri İçin Karşılaştırılması [Comparison of Predictive Performance of Logistic Regression and CART Methods for Life Satisfaction Data]. Avrupa Bilim ve Teknoloji Dergisi, 18, 719-727. https://doi.org/10.31590/ejosat.691215
Yılmaz, E. (2012). İstatistiksel Analiz Yöntemi Olarak Veri Madenciliğinde CHAID Algoritması ve Türkiye’de İşgücü Piyasasının Durumunun ve Bunun Nedenlerinin Belirlenmesine İlişkin Bir Uygulama [The Chaid Algorithm in Data Mining As A Statistical Analysis Method and An Application Including Determination to the Situation of Labour Market and Its Reasons in Turkey], Master’s Thesis, Yıldız Technical University, Graduate School of Social Sciences, Department of Business Administration.
Yılmaz, F., & Akkaya, G. C. (2020). Kripto Para Piyasalarında Etkinlik; Haftanın Günü Etkisi: Bitcoin ve Litecoin Örneği [The Efficiency in Cryptocurrency Markets; The Day of the Week Effect: Bitcoin and Litecoin Example]. Girişimcilik İnovasyon ve Pazarlama Araştırmaları Dergisi, 4(8), 166-178. https://doi.org/10.31006/gipad.767255
Zhao, Y., & Zhang, Y. (2008). Comparison of decision tree methods for finding active objects. Advances in Space Research, 41(12), 1955-1959. https://doi.org/10.1016/j.asr.2007.07.020
*Corresponding Author:
Graduate School of Science and Engineering, Department of Statistics , Yıldız Technical University, Turkey
Email address: mert_9034@hotmail.com