D:\My Journal\Logo\kam logo.JPG                                                                  JOURNAL OF CONTEMPORARY URBAN AFFAIRS, 6(2), 217-231/ 2022

D:\My Journal\Logo\kam logo.JPG


Journal of Contemporary Urban Affairs

                                                                                           2022, Volume 6, Number 2, pages 217–231

Original scientific paper

Correlation between Socio-Economic Characteristics and Housing Quality of Residential Neighbourhoods in Akure, Southwest Nigeria             

*1 Dr. Adewale Mukhtar Olayiwola, 2  Professor Dr. Olayinka Akinsumbo Ajala

1& 2  Department of Geography, Obafemi Awolowo University, Ile-Ife, Nigeria

1 E-mail: amolayiwola@oauife.edu.ng , 2 E-mail: aajala@oauife.edu.ng


ARTICLE INFO:


Article History:

Received: 10 August 2022

Revised: 15 September 2022

Accepted: 28 October 2022

Available online: 8 November 2022


Keywords:

housing quality;

socio-economic characteristics;

residential neighbourhood;

sustainable housing delivery system;

quality of life in Nigerian;

ABSTRACT                                                                                                                       


There is a general paucity of explanations for the emerging social and spatial changes in the pattern and socio-economic traits of urban residential housing units in Nigeria. Hence, this study examined the spatial pattern of residential neighbourhoods; assessed the quality of residential housing units; and evaluated the correlation between the socio-economic position of respondents and housing quality in Akure, Nigeria. Data were derived from the household questionnaire, remotely sensed data (Landsat 8 OLI/TIR, 2021), a Google Earth map, a Street Map of Akure Township, and personal observations. The study adopted a step-wise sampling technique to select 383 samples from 139,069 heads of households in Akure in 2021. Data were analysed using percentage distribution, Pearson Correlation Coefficient, and t-test. Results indicated varying housing qualities across three residential zones in Akure, Nigeria; houses in the low-density residential areas were of better quality than the other residential zones. The quality of houses occupied was influenced by the type of occupation, level of education and average annual income of residents. The study concluded that inadequate housing facilities are fundamental to the observed deteriorating housing qualities in the study area. Therefore, the study suggested improvement of the existing infrastructures and the provision of new ones in the study area. The main contribution of this study is to proffer solutions for a sustainable housing delivery system to facilitate a better quality of life in Nigerian urban centres.


This article is an open-access article distributed under the terms and conditions of the Creative Commons Attribution 4.0 International (CC BY 4.0)

C:\Users\Hourakhsh\Desktop\CC_By_2020_licnece1.jpg

Publisher’s Note:

Journal of Contemporary Urban Affairs stays neutral with regard to jurisdictional claims in published maps and institutional affiliations.

JOURNAL OF CONTEMPORARY URBAN AFFAIRS (2022), 6(2), 217-231.

https://doi.org/10.25034/ijcua.2022.v6n2-8

www.ijcua.com

Copyright © 2022 by Olayiwola, A. M., & Ajala, O. A.


1. Introduction

Housing is consumed with some other items which appear to have no relationship with the land and its uses; one tends to be independent of another. The importance of providing adequate and quality housing in any country cannot be overstressed (Jiboye, 2010; Zainal et al., 2012; Adeleye et al., 2014; Haque et al., 2020). However, the re-current quality of housing requirements and the interminable craving for good housing appears to confirm the impression that there may be to cope satisfactorily with housing requirements (Hsu & Guo, 2006; Owoeye & Ogundiran, 2014; Page & Gordon, 2017; Jochem et al., 2018). Thus, to satisfactorily appraise the quality and evaluate the characteristics of a house, it is important to assess the sociocultural heterogeneity and economic status of the individual property owner.

For this study, housing is regarded as dwelling units occupied by households. From this perspective, three types of housing can be recognised in urban centres: self-built housing development, private developer-led housing and public housing development. Whereas self-built housing is a single-family property, the other two types are owned by corporate organisations, which could be private or government. Self-built housing units are the most predominant type of housing units in developing countries (Gough & Yankson, 2000; Coker et al., 2008; Brkanic, 2017). However, they vary greatly both in characteristics and qualities.

Housing quality can be described as the standard of the residential environment that provides residents with sustainable accessibility, healthy, safe and beautiful accommodation. Housing quality embraces many factors such as the physical condition of the building and other facilities and services that make living in a particular area conducive. Fakunle et al. (2018) corroborated by Wimalasena et al. (2022) submitted that the quality of housing within any neighbourhood should be such that satisfies minimum health and good living standards. Such houses are also required to be affordable to all categories of households. Studies have found that there exists a direct relationship between housing quality and quality of life (Zhonghua & Xuejun, 2015; Fakunle et al., 2018). Therefore, good housing quality is a basic requirement to guarantee stable communities and social inclusion (Konadu-Agyemang, 2001; Wimalasena et al., 2022).

Housing is regarded as one of the major factors determining the form of cities. Hence, a major concern in spatial analysis is the geographical distribution and pattern of housing within cities. Residential housing pattern has been the subject of considerable research for many years. The spatial arrangement of housing units in urban environments has been explained in some theoretical frameworks (Burgess, 1925; Hoyt, 1939; Harris & Ullman, 1945). Burgess (1925) developed the concentric zone model as the first theory to describe the internal structure of a city. The central thesis embedded in Burgess’s model is that urban residence conforms to a zonal pattern. Hoyt (1939) proposed the sector theory wherein he considered direction and distance to explain the outward extension of the residential areas along district radii with new growths on the outer arc of the sector. Harris & Ullmann (1945) provided an innovative description that analyses the spatial structure of urban areas in the multiple-nuclei theory.

Many studies have been carried out on urban housing in both the developed and developing worlds. For instance, in recent times there has been an extraordinary revival of interest in the spatial preferences of households in choosing a residential location, especially in the urban area. In the more advanced countries of America, the United Kingdom and the eastern part of the world, several studies have examined the changes in the pattern of residential houses (Kearney, 2006; Kurniati & Erlambang, 2015; Gnatiuk & Kryvets, 2018; Premier, 2021). Also, studies have been conducted to unravel the spatial dimensions of neighbourhood housing quality (Myung-Jin, 2013; Haque et al., 2020). Furthermore, some studies have been conducted to examine the factors influencing housing quality (Sweis et al., 2014; Rajaei & Mansourian, 2017; Ren et al., 2019). Besides, there are quite ample studies on liveability in residential neighbourhoods (Streimikiene, 2015; Zhonghua & Xuejun, 2015; Satu & Chiu, 2019).

In the developing world, particularly, Nigeria, several studies have been carried out on urban housing (Gough, 2000; Arku et al., 2011; Filali, 2012; Baer, 2014; Adedire & Adegbile, 2017; Ezeanah, 2020). In recent times, there is a revitalisation of interest in the spatial preferences of households in choosing residential locations within an urban environment (Fakunle et al., 2018). Moreover, studies have shown that residential neighbourhoods exist in different patterns (Fasakin, 2018). Furthermore, studies have revealed that there are gross inequalities in the quality of residential housing units (Ogu, 2002; Morenikeji et al., 2017; Thomas & Hassan, 2018; Ezeanah, 2020). There are many studies on the poor environmental and health condition of slum areas and squatter settlements (Fadairo & Ganiyu, 2010; Omole, 2010; Babalola et al., 2016). In addition, studies have been conducted on factors influencing housing quality (Yoade et al., 2015; Yoade et al., 2018). Also, several efforts have been made at documenting the characteristics and conditions of residential housing units in Nigerian urban centres (Salami, 2016). There are scanty studies on urban housing in Akure, where the present study was conducted. Omole (2010) assessed housing conditions and socio-economic lifestyles of slum dwellers in Akure, Nigeria. In another study, Fasakin et al. (2018) focused on the impacts of land pricing on the pattern of residential density in Akure.

From the foregoing, it is obvious that while most of these studies only provided general views on housing, some others focused on just one particular aspect of urban housing. In other words, none of the existing studies on Akure has combined themes of urban housing quality and characteristics with the pattern of the residential neighbourhood. Yet, this is a major policy issue that should not be underemphasised. Therefore, this study seeks to fill the gap in the emerging social-spatial transformations by advancing knowledge on the physical structure and socio-economic characteristics of urban residential housing units in developing countries using Akure, Ondo State, Nigeria as a case study. Thus, this study assessed the relationship between housing quality and the socio-economic characteristics of residents in the study area. Also, the study examined environmental issues associated with people living in the study area. Furthermore, the study evaluated the resulting pattern of the residential neighbourhood in the study area. These were with the view of offering explanations for sustainable housing delivery systems to improve living conditions in Nigerian urban centres.


2.The Study Area

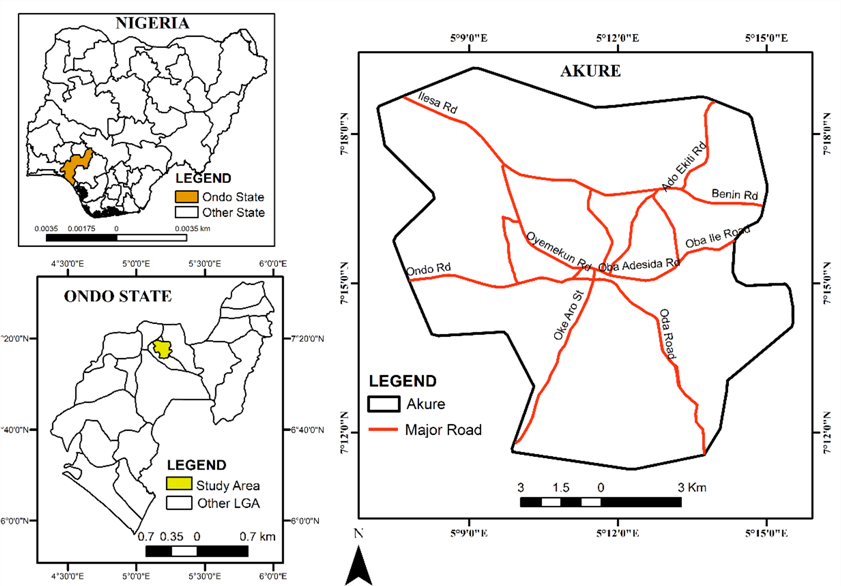
The study was carried out in Akure, Ondo State, Nigeria. It lies between latitudes 7°07'N and 7°37'N and longitudes 5°06'E and 5°38'E (Figure 1). Akure, with a land area of approximately 991km², is the capital city of Ondo State with two Local Government Areas (LGA); Akure South and Akure North LGAs (Ibitoye et al., 2017). The aboriginal people are of the Yoruba tribe, though there are other tribes such as Igbira, Igbo, Edo and Hausa, among others. Major economic activities include farming, trading, tourism, and civil service. Also, the inhabitants of Akure engage in scale indigenous industrial works such as cloth weaving, gaari production, block and bakery activities (Eades, 1980; Daniel, 2015; Ondo State Ministry of Agriculture and Natural Resources, OSMANR, 2015; Ibitoye et al., 2017).


Figure 1. The Study Area.

Sources: Landsat 8 OLI/TIR, 2021; Google Earth map, 2021

Town Planning Division of Akure South Local Government Area.


According to the National Population Commission of Nigeria (NPC), the population of Akure in the last national headcount conducted in 2006 was 353,211 (NPC, 2006). Based on this census result, the population of the study area for the current year of study, 2021, was estimated using an official annual growth rate of 3.2% for urban centres in Nigeria (Nigeria Bureau of Statistics, NBS, 2021). However, because the population is compounded annually, the addition of annual growth rate (r) and 1 (a constant that denotes the inclusion of the current year in the calculation) was raised to a power of the number of years for which the population was projected (t) and multiplied by the population of the base year (Po). The formula is given as follows (Equation 1):

(Eq. 1)


Due to its latitudinal location, Akure experiences a tropical humid climate with two distinct seasons; wet and dry seasons. The wet season starts in April and ends in October, spanning over seven months. The total annual rainfall ranges between 1300mm and 1650mm (Asiwaju-Bello et al, 2013; OSMANR, 2015). Temperature is generally high during the day, especially in March and April. The annual mean temperature is 29°C. While evaporation is usually low from June to September (3.3mm to 4.0mm per day), relative humidity ranges between 5% and 90%, between the seasons (Asiwaju-Bello et al, 2013). The vegetation of Akure is rain forest consisting of valuable trees used for timber products such as Mahogany, Obeche, Iroko, and Afara. However, the area is fast becoming a derived forest zone due to persistent clearance of the vegetation.

The study area contains lowlands and rugged hills (between 315m and 402m above the mean sea level). While the northeastern part consists of basement complex rocks, the southern section comprises sand ridges, lagoons, swamps, and creeks. The soils are mostly tropical ferruginous with varied textures and gravel content (Ibitoye et al., 2017).


3.Materials and Methods

3.1. Data Sources

Data for the study were extracted from Landsat 8 OLI/TIR, Google Earth map, Street Map of Akure, and household questionnaire (Table 1). Also, detailed personal observations were carried out using handheld GPS for recording the location attributes of major landmarks in the study area.


Table 1. Characteristics and Sources of Data.

Data

Year

Resolution

Path/Row

Source

Questionnaire

2021

N/A

N/A

Field Survey

Township Map of Akure

2016

N/A

N/A

Town Planning, Akure South LGA

Shapefiles of:

Nigeria

Ondo State

Akure


2021

2021

2021


N/A

N/A

N/A


N/A

N/A

N/A


AFRIGIST, O.A.U. Ile-Ife

AFRIGIST, O.A.U. Ile-Ife

AFRIGIST, O.A.U. Ile-Ife

Landsat 8 OLI/TIR

March 6, 2021

28.5m

190/055

http;//glcf.umiacs.umd.edu

GoogleEarth map, Akure

Accessed:

September 10, 2021


N/A


Population data

2006

N/A

N/A

NPC, Nigeria

GPS Coordinate

2021

N/A

N/A

Ground Truthing

Notes:

N/A: Not Applicable

AFRIGIST: African Regional Institute for Geospatial Information Science and Technology

O.A.U.: Obafemi Awolowo University, Ile-Ife


The sample frame for this study includes all heads of households in the study area. In 2006 there were 89,263 households in Akure (NPC, 2006). However, there has not been another national headcount in Nigeria since 2006, therefore, the study used an estimated number of households based on the official annual growth rate of 3% for urban centres in Nigeria (FBS, 2021). The compound interest formula was used to calculate the number of households for the current year of study, 2021, as contained in Equation 2.


           (Eq. 2)


Where:

A = number of households for the current year, 2021.

P = number of households in the last headcount, 2006 (= 89,263).

r = annual rate of increase (FBS, 2021) = 3% (0.03).

n = number of times the increase is compounded per year (= 1).

t = number of years between the last headcount and the current year (=15 years)

Applying the formula, the number of households in Akure in 2021 was 139,069. The appropriate sample for this study was determined using an online calculator (Creative Research Systems - Sample Size Calculator). Thus, 383 out of the total 139,069 households in Akure in 2021 were selected for this study. A stratified sampling technique was adopted in the selection of residential housing units for the study. However, noting that there were variations in the quantity and concentration of buildings, the study area was categorised into three strata:

  1. High-Density Residential Zone (HRZ)
  2. Medium-Density Residential Zone (MRZ)
  3. Low-Density Residential Zone (LRZ)

Furthermore, using the online calculator with particular consideration for the differences in building clusters, the 383 samples were distributed among the three residential zones (Table 2).


Table 2. Distribution of Samples in the Study Area.

S/N

Zone

Number of Households

Sample Size

1.             

High (HRZ)

50,417

195

2.             

Medium (MRZ)

45,021

119

3.             

Low (LRZ)

39,581

69

Total

135, 019

383


3.2. Data Analysis

The study adopted a combined process of visual image interpretation and digital image processing to identify similar clusters of pixels that characterise the land use class of interest. Thus, following the supervised image classification procedure by adopting the maximum likelihood algorithm, the area was classified into two broad land uses/covers:

  1. Built-up area: all areas containing building structures.
  2. Non-built-up area: this included vegetation, water body, and bare surfaces.

The spatial accuracy assessment utilised included producer accuracy (PA), user’s accuracy (OA), and overall accuracy (OA) indices (Table 3). Also, KAPPA analysis was performed to ascertain the level of accuracy of image classification. Moreover, z statistics were calculated to validate the reliability of the imagery accuracy assessment (Sinha, 2016).


Table 3. Distribution of Validation Points (by LULC).


S/N


LULC Class

No. of Points

Topographical Map

GoogleEarth Map

Ground Points

  1.  

Built-up

28

46

55

  1.  

Non-built-up

35

55

60


Total

63

101

115


To vividly describe the pattern of the residential neighbourhood in the study area, features of interest such as major roads and the built-up area were digitised in Google Earth and saved as kml files for further processing in ArcGIS. The converted layers were then overlaid on a Google Earth map of Akure where on-screen digitising was employed to extract the built-up area and streets. Using the Google Earth map complemented with the ground-truthing, the densities of the buildings were digitised to classify the study area into three residential zones: High-density, Medium-density, and Low-density residential zones.

The first step in the analysis of data obtained through the questionnaire involved the identification of parameters and variables for assessment. Two parameters were involved in the analysis; the socio-economic status of respondents and the quality of buildings (Table 4).


Table 4. Parameters and Variables for Assessment.

S/N

Parameters

Variables

Tag


1.


Socio-economic (n = 6)

Age

x1

Gender

x2

Marital Status

x3

Level of Education

x4

Occupation

x5

Average Income

x6

2.

Housing Quality (n = 11)

House Type

y1

Floor

y2

Wall

y3

Painting

y4

Roof

y5

Ceiling

y6

Water

y7

Toilet

y8

Waste

y9

Electricity

y10

Fence

y11


Data obtained through the questionnaire were analysed using percentages and mean which were used to assess the socio-economic characteristics of heads of households in Akure, and to evaluate the characteristics and quality of housing units in Akure. The relationship between socioeconomic status and the quality of buildings occupied by respondents in the study area was determined using Pearson Correlation Coefficient (Equation 3). The purpose of the Pearson correlation coefficient (denoted by r and also known as Pearson product-moment correlation coefficient) is to determine the relationship between two quantitative variables and the degree to which the two variables coincide with each another. In this study, the Pearson correlation coefficient was employed to measure the linear relationship between socioeconomic status and the quality of buildings in the study area.


                   (Eq. 3)

Where:

= socio-economic characteristics of respondents (, Table 4)

= the quality of the building (, Table 4)


In Pearson Correlation Coefficient, the correlation is strong (or high) if r is ±0.50 ≤ ± 1; moderate degree if r r is ±0.30 ≤ ± 0.49, and low (or small) correlation when the value lies below +0.29.

Housing quality was derived by finding the average of the mean values of (Equation 4).

y = ∑ (1 + 2 + ……. 11)/n  (Eq. 4)

Therefore, the variance of housing quality was derived by finding the average of the variance values of (Equation 5).

y = ∑ (1 + 2 + ……. 11)/n  (Eq. 5)


4.Results and Discussion

4.1. Image Analysis

This section contains the results of image analysis such as classification into land use/cover classes, area statistics calculation, accuracy assessment, and extraction of the built-up class.

4.1.1. General landcover of the study area

For this analysis, the land use and land cover (LULC) in the study area were classified into two broad classes; built-up and non-built-up areas (Table 5). While the non-built-up area covered just about a quarter of the total land area (26.9%), the built-up covered 73.1% (Table 5).

Table 5. Imagery classification.

Class Name

Area covered (km²)

% (of Total Land area)

Built-up

724.42

73.1

Non-built up

266.58

26.9

Total

991

100

Sources: Landsat OLI/TIRS 2021 (Path 190 Row 55).


Figure 2 shows the spatial occurrence and area extent of the two classified land covers in Akure in 2021. The built-up was found in almost every part of the study area. Although the built-up area has spread to almost every part of Akure, there were still patches of non-built-up portions in the city. At this stage, Akure can be described as a fully developed urban centre in 2021.


Figure 2. General landcover of Akure, 2021.


4.1.2. Results of accuracy assessment

Results of the image classification accuracy assessment indicate that the producer’s accuracy (PA) = 97.66, the user's accuracy (UA) = 100.00, and the overall accuracy (OA) was 99.74% (Table 6). Kappa analysis was 0.9237 and z statistic yielded 44.08. These values indicate that there were significant agreements between the validation points and the extracted classes (Zanon et al., 2019).


Table 6. Imagery classification and accuracy assessment.

Sources: Landsat OLI/TIRS 2021 (Path 190 Row 55)

Note: PA = producer’s accuracy, UA = user’s accuracy, OA = overall accuracy


4.2. The Built-up Area of Akure

The built-up area comprises residential quarters, business premises, and public utility buildings. Residential quarters provide accommodation for the human being; they are where man lives. Business premises are areas of commerce and economic activities. The business premises also include areas of industrial activities, whether local (indigenous) or modern. Public utility buildings are such areas that provide a common palace for community/township activities. Among such public buildings are the king’s palace, town hall, places of worship (churches and mosques), all-day open market system, police station as well as educational and health institutions. Figure 3 shows the spatial occurrence and the extent of the built-up area of Akure in 2021. The built-up area occupied an area of 724.42 km² (73.11%) spread to every part of the study area.


Figure 3. The Built-up Area of Akure, 2021.

Source: Landsat 8 OLI/TIR, 2021


4.2.1. Pattern of the Residential Neighbourhood

The residential neighbourhood includes all areas occupied by residential buildings. These buildings were found in every part of the study area; however, the heaviest density was in the central part of the study area where the development impulses were more concentrated. Public utility buildings like the palace, town hall, many places of worship (churches and mosques), all-day open market system and oldest buildings in the city were found to form circular rings around Arakale, Igisan, Oba-Adesida Road, and CMS areas of the settlement (Figure 4). Asides from this concentration, sporadic developments dotted some areas in the northern and eastern parts of the study area. The pattern exhibited by the built-up area in the central part was found to be following the Concentric Zonation pattern identified by Burgess in 1925 (Figure 4).             

Housing developments were found to follow the axial corridors created by the roads. This is most noticeable along Akure – Benin, Akure – Ado Ekiti, Akure – Ondo, and Akure – Ilesa roads (Figure 4). Thus, this encouraged the development of a linear pattern of growth similar to Hoyt’s sectorial pattern (Hoyt, 1939).


Figure 4. Pattern of Residential Neighbourhood in Akure.


4.3. Socio-Economic Characteristics of Respondents

The average monthly income of respondents was based on a threshold of 30,000 ($66.67) which was the minimum labour wage in the country at the time of this study. Respondents in the area were well-educated with only 13.8% without any formal education. Also, the majority of the respondents were gainfully employed; only 11.5% were either students or unemployed. However, at the zonal level of analysis, there were some internal disparities in the socio-economic characteristics of respondents. For instance, whereas primary and secondary education were mostly favoured in the HRZ, secondary and tertiary education were more prominent in the other zones. Also, in the HRZ and MRZ, trading and craftmanship were the major human occupations, while civil service and trading were the most attractive occupations in the LRZ. Though, income distribution appears to be similar across the three zones; the point of departure was in the spread of middle-high income (200,001; $444.44 - 500,000; $1,111.11); the majority of whom were found in the LRZ (Table 7).


Table 7. Socio-Economic Characteristics of Respondents.

Tag


Characteristics

Residential Zones

Total

High

Medium

Low

N

%

n

%

N

%

N

%

X1

Age

18 - 40 years

41 – 65 years

Above 65

Total


31

86

78

195


15.9

44.1

40.0

100


26

54

39

119


21.8

45.4

32.8

100


9

23

37

69


13.1

33.3

53.6

100


66

163

154

383


17.2

42.6

40.2

100

X2

Gender

Male

Female

Total


122

73

195


62.6

37.4

100


78

41

119


65.5

34.5

100


51

18

69


73.9

26.1

100


251

132

383


65.5

34.5

100

X3

Marital Status

Married

Single

Divorced

Widowed

Total


88

36

24

47

195


45.1

18.5

12.3

24.1

100


76

20

8

15

119


63.9

16.8

6.7

12.6

100


36

27

4

2

69


52.2

39.1

5.8

2.9

100


200

83

36

64

383


52.2

21.7

9.4

16.7

100

X4

Level of Education

No Formal Education

Primary Education

Secondary Education

Tertiary Education

Total


32

51

74

38

195


16.4

26.2

37.9

19.5

100


13

28

42

36

119


10.9

23.5

35.3

30.3

100


8

4

21

36

69


11.6

5.8

30.4

52.2

100


53

83

137

110

383


13.8

21.7

35.8

28.7

100

X5

Occupation

Civil Service

Self-employed/Craftsmanship

Trading

Others

Unemployed

Total


14

65

72

21

23

195


7.2

33.3

36.9

10.8

11.8

100


21

39

30

16

13

119


17.6

32.8

25.2

13.4

10.9

100


31

7

12

11

8

69


44.9

10.1

17.4

15.9

11.6

100


66

111

114

48

44

383


17.2

29.0

29.8

12.5

11.5

100

X6

Average Monthly Income

< 30,000* (< $66.67**)

30,000 ($66.67) - 100,000 ($222.22)

100,001 ($222.22) - 200,000 ($444.44)

200,001 ($444.44) - 500,000 ($1,111.11)

>500,000 (> $1,111.11)

Total


48

82

34

28

3

195


24.6

42.1

17.4

14.4

1.5

100


34

31

22

23

9

119


28.6

26.0

18.5

19.3

7.6

100


10

8

21

24

6

69


14.5

11.6

30.4

34.8

8.7

100


92

121

77

75

19

383


24.0

31.6

20.1

19.6

4.7

100

Source: Field Research, 2021

Notes: *The official minimum wage in Nigeria was 30,000 (USD 66.67) per month. 

          **Conversion was based on a conversion rate of 450 to $1 as of September 2021


4.4. Quality and Characteristics of Residential Houses

The most common types of residential housing units in the study area were of the traditional type (50.1%). Modern flat buildings and duplexes were more common in the low residential area. Materials used for flooring indicated that modern techniques were not yet fully adopted in the study area; concrete or cement flooring styles still predominates in Akure at an average of 50.9% with the highest proportion found in the high-density residential zone (66.2%). Modern and fashionable flooring styles were not fully adopted; while only 44.6% were tilled, just 3.4% used terrazzo materials (Table 8). However, standard roofing and ceiling materials were being gradually accepted in the area (asbestos ceiling, 50.1%; plastic P. O. P. 24.5%; carved P. O. P 22.5%).

Results indicated that 67.1% of the sampled houses were fully plastered. However, internal variations between the zones reveal that 75.9% in the high-density zone and 71.0% in the low-density zone were fully plastered. This contrasted the situation in the medium-density zone where only 50.4% were fully plastered; none of the buildings was with mud walls. (Table 8).


Table 8. Quality and Characteristics of Residential Buildings in Akure.

Tag


Materials Used for Construction

Residential Zones

Total

High

Medium

Low

n

%

n

%

n

%

N

%

Y1

House Type

Traditional compound (Bungalow)

Traditional compound (Storey Building)

Traditional compound (mixed)

Bungalow (flat)

Storey Building (Multi-flat)

Duplex

Total


84

43

9

32

21

6

195


43.1

22.1

4.6

16.4

10.8

3.1

100


16

27

5

41

16

14

119


13.4

22.7

4.2

34.5

13.4

11.8

100


7

15

0

18

6

23

69


10.1

21.7

0.0

26.1

8.7

33.3

100


107

85

14

91

43

43

383


27.9

22.2

3.7

23.8

11.2

11.2

100

Y2

Flooring

Mud or Earth

Concrete/Cement

Tiles

Terrazzo/Granolithic

Total


3

129

62

1

195


1.5

66.2

31.8

0.5

100


0

62

51

6

119


0.0

52.1

42.9

5.0

100


1

4

58

6

69


1.4

5.8

84.1

8.7

100


4

195

171

13

383


1.0

50.9

44.6

3.4

100

Y3

Walling

Mud only

Plastered mud

Clay bricks

Concrete blocks

Plastered concrete blocks

Total


3

16

7

21

148

195


1.5

8.2

3.6

10.8

75.9

100


0

9

16

34

60

119


0.0

7.6

13.4

28.6

50.4

100


1

2

12

5

49

69


1.4

2.9

17.4

7.2

71.0

100


4

27

35

60

257

383


1.0

7.0

9.1

15.7

67.1

100

Y4

Roofing

Asbestos sheets (Addex)

Concrete Deck

Zinc

Roofing Tiles

Total


10

8

175

2

195


5.1

4.1

89.7

1.0

100


2

13

96

8

119


1.7

10.9

80.7

6.7

100


2

7

25

35

69


2.9

10.1

36.2

50.7

100


14

28

296

45

383


3.7

7.3

77.3

11.7

100

Y5

Ceiling Materials

Asbestos

Concrete

Carved P. O. P.

Plastic P. O. P.

Total


110

8

19

58

195


56.4

4.1

9.7

29.7

100


59

3

36

21

119


49.6

2.5

30.3

17.6

100


23

0

31

15

69


33.3

0.0

44.9

21.7

100


192

11

86

94

383


50.1

2.9

22.5

24.5

100

Y6

Painting

Entire Building

Inside only

Outside only

Not painted

Others

Total


76

32

1

64

22

195


39.0

16.4

0.5

32.8

11.3

100


52

21

3

41

2

119


43.7

17.6

2.5

34.5

1.7

100


42

13

1

9

4

69


60.9

18.8

1.4

13.0

5.8

100


170

66

5

114

28

383


44.4

17.2

1.3

29.8

7.3

100

Y7

Water Sources (main source)

Borehole

Well

River/stream

Public water service

Total


39

103

0

53

195


20.0

52.8

0.0

27.2

100


37

64

1

17

119


31.1

53.8

0.8

14.3

100


43

19

1

6

69


62.3

27.5

1.4

8.7

100


119

186

2

76

383


31.1

48.6

0.5

19.8

100

Y8

Toilet facility

Water system

Pit

Bush

River/stream

Public toilet

Total


110

29

0

0

56

195


56.4

14.9

0.0

0.0

28.7

100


71

31

0

1

16

119


59.7

26.0

0.0

0.8

13.4

100


59

4

4

1

1

69


85.5

5.8

5.8

1.4

1.4

100


240

64

4

2

73

383


62.7

16.7

1.0

0.5

19.1

100

Y9

Electricity (main source)

Public

Generator

Solar/inverter

Others (candles, lanterns, rechargeable lamps)

Total


14

153

22

6

195


7.2

78.5

11.3

3.1

100


12

69

36

2

119


10.1

58.0

30.3

1.7

100


10

28

29

2

69


14.5

40.6

42.0


100


36

250

87

10

383


9.4

65.3

22.7

2.6

100

Y9

Security fence

Full

Part

None

Total


61

14

120

195


31.3

7.2

61.5

100


68

23

28

119


57.1

19.3

23.5

100


49

13

7

69


71.0

18.8

10.1

100


178

50

155

383


46.5

13.1

40.5

100

Y10

Waste disposal

Containers/bags

Open dump site

Gutter

Public dust bin

Private collector

Burning

Landfilling

Stream

Total


27

33

7

72

31

19

4

2

195


13.8

16.9

3.6

36.9

15.9

9.7

2.1

1.0

100


21

12

1

59

14

5

7

0

119


17.6

10.1

0.8

49.6

11.8

4.2

5.9

0.0

100


8

1

2

21

27

7

2

1

69


11.6

1.4

2.9

30.4

39.1

10.1

2.9

1.4

100


56

46

10

152

72

31

13

3

383


14.6

12.0

2.6

39.7

18.8

8.1

3.4

0.8

100

Source: Field Research, 2021


4.5. Correlation between Socio-Economic Characteristics and House Quality

Results of coefficients of correlation between socio-economic characteristics of respondents and house quality at the level of the residential zone in Akure, Nigeria indicated that there were high correlations between house quality and level of education (r = 0.99) in the high- and medium-density residential zones (Table 9). In the low-density residential zone, only occupation had a significant relationship with housing quality (r = 0.60). There were inverse correlations between housing quality and average monthly income (-0.454), and marital status (-0.689).


Table 9. Correlation between Socio-economic Characteristics and Housing Quality (by Zone).


House Quality

Age

Gender

Level of Education

Occupation

Average Annual Income

Marital Status

High-Density Residential Zone

Housing

1.000


Age

0.613

1.000


Gender

0.338

0.796

1.000


Level of Education

0.993

0.871

0.678

1.000


Occupation

0.428

0.813

0.769

0.813

1.000


Average Annual Income

0.978

0.886

0.750

0.919

0.797

1.000


Marital Status

0.868

0.909

0.926

0.805

0.077

0.952

1.000

   Medium-Density Residential Zone

Housing

1.000


Age

0.736

1.000


Gender

0.695

0.698

1.000


Level of Education

0.900

0.901

0.767

1.000

0.334


Occupation

0.313

0.924

0.879

0.334

1.000


Average Annual Income

-0.454

0.906

0.805

-0.285

-0.904

1.000


Marital Status

-0.689

0.898

0.967

-0.909

-0.573

0.374

1.000

   Low-Density Residential Zone

Housing

1.000


Age

0.922

1.000


Gender

0.426

0.817

1.000


Level of Education

0.408

0.913

0.678

1.000


Occupation

0.601

0.877

0.769

0.442

1.000


Average Annual Income

0.470

0.968

0.750

0.129

0.508

1.000


Marital Status

0.366

0.997

0.914

0.997

-0.464

-0.154

1.000

Source: Field Research, 2021


At the level of the entire city, results indicate that all the socio-economic characteristics considered have a high correlation with the quality of residential housing units occupied by the respondents. Level of education with a correlation coefficient of 0.588 has the weakest correlation with housing quality in the study area (Table 10).


Table 10. Aggregate Correlation of Housing Quality and Socio-Economic factors.


House Quality

Age

Gender

Level of Education

Occupation

Average Annual Income

Marital Status

High-Density Residential Zone

Housing

1.000


Age

0.613

1.000


Gender

0.338

0.796

1.000


Level of Education

0.993

0.871

0.678

1.000


Occupation

0.428

0.813

0.769

0.813

1.000


Average Annual Income

0.978

0.886

0.750

0.919

0.797

1.000


Marital Status

0.868

0.909

0.926

0.805

0.077

0.952

1.000

Source: Field Research, 2021


4.6.  Discussion

The socioeconomic variables considered in this study spread across all works of life. The high similarity of some of the socio-economic characteristics considered among the three residential zones in the study area indicates that the population in the study was of homogeneous characteristics. Results of the general land use/cover analysis through Landsat imageries show that more than half (55.1%) of the total land in the study area had been built up. Though there were sporadic developments in other parts, there was a remarkable expansion of the built-up area in the central part. This corroborates the findings of other studies that residential land accounts for the largest proportion of total urban land uses in many African cities (Coker et al., 2008; Arku et al., 2011; Ezeanah, 2020).

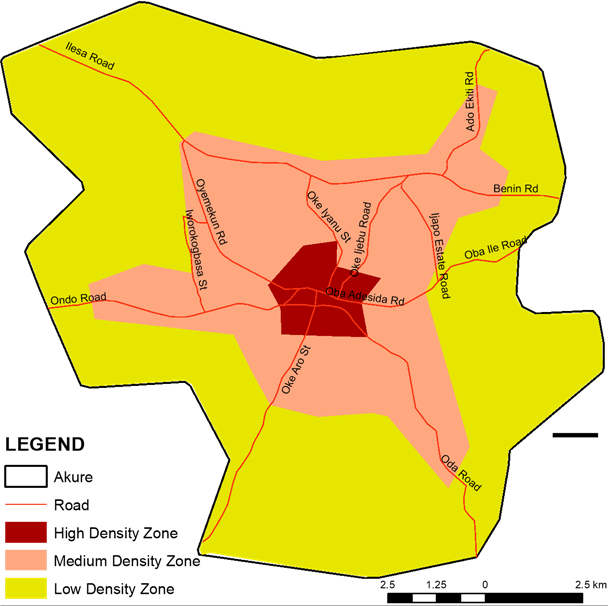
Like Ogu (2002), this study identified three residential zones in the study area based on building densities (high-density, medium-density, and high-density zones). The high-density zone is the core area of the city where the oldest buildings are found; this is where the settlement started. The zone lacks planning controls and there was a very little touch of modern technology in the housing standards. However, some of the buildings have been either renovated or reconstructed, particularly along the major roads. This zone houses the largest share of the business and economic activities in the city; therefore, the area was swarming with a large population, and of course the attendant noisy environment.

In the medium-density residential zone, there were traces of the introduction of new waves of development. The houses were of better quality than in the old core of the city. The majority of the inhabitants of this zone were average-income earners who were able to own a house or afford to pay the house rent. This zone contains more roads, most of which lead outwards from the city. Thus, in place of the concentric pattern formed in the high-density zone, foundations for the sectorial pattern were laid in the medium-density area. The low-density residential zone was a bit more orderly with sophisticated building materials than other zones. In agreement with Jiboye (2010), housing facilities in this zone were found to be better and more sufficient than in the other zones. Residential houses in this zone agree with the description of some earlier studies that housing is not just a shelter because it includes all the social services and utilities that make a neighbourhood a habitable setting (Kearney, 2006; Adeleye et al., 2014; Brkanic, 2017).

The observed variations in the quality and characteristics across the different residential zones in Akure might not be unconnected with the educational levels and type of occupation of the inhabitants (see Table 7). Considering the settlement at large, though mud walls and earth-surfaced floors are fast disappearings in the study area, the result indicates that the level of technology of building construction in the area was still at a rudimentary level.


5.Conclusion

This study has shed some light on the quality and condition of residential housing in Akure, especially in terms of adequacy of basic housing utilities as well as relationships between the socio-economic characteristics of residents and the quality of buildings occupied in Akure, Nigeria. Results of the study have revealed that there were differential relationships between house quality and the socio-economic characteristics of respondents across the three residential zones in Akure, Nigeria. For instance, there were high correlations between house quality and level of education in the high- and medium-density residential zones. In the low-density residential zone, only occupation had a noteworthy relationship with housing quality. However, there were inverse correlations between housing quality and an average monthly income as well as marital status in all the zones. Moreover, the study observed that inadequate housing facilities are fundamental to the observed deteriorating housing qualities in the study area. Therefore, the study recommends as follows.

First, for sustainable housing delivery in the study area, house owners should be educated on the relationship between essential housing facilities and the health of the inhabitants. This will encourage property owners to accept any byelaws that may be enacted to induce housing providers to provide certain basic services in their houses. Second, noting that poor housing quality is linked with low income, poverty alleviation programmes should be improved to reduce the unemployment rate in the country which will enhance the provision for basic household facilities and proper maintenance of buildings. Moreover, there is a need for a renewal programme through a renovation approach and the construction of more roads to open the devastated areas.

Although few concepts of housing quality were explored in this study, it makes some relevant contributions to the existing body of knowledge on housing research. It has shed some light on the opinions of residents on the quality and condition of housing in Akure, Nigeria. Also, the study has successfully employed Remote Sensing and Geographical Information System techniques to evaluate the pattern and quality of residential housing units which did previously not exist in the study area. In addition to this, the study has incorporated housing patterns and housing quality in just one research, which is very infrequent. Furthermore, the findings of the study, through the statistical analysis of the correlation between the socio-economic characteristics of respondents and house quality, have provided a set of specific factors influencing house quality and characteristics in the study area. Nonetheless, one major policy implication that can be drawn from the findings of this study is that adequate and effective measures to ensure residential land use development control should be introduced. Therefore, it is hoped that the findings of this study will provide a sufficient basis for policy attention on housing improvements in major urban centres in the country. The evaluated concepts can serve as a basis for further studies on housing quality assessment. Also, this study can be used as a foundation for the evaluation of other sets of valuable criteria for analysing the characteristics and quality of residential housing.


Acknowledgements

The authors gratefully acknowledge the support from the African Regional Institute for Geospatial Information Science and Technology (AFRIGIST), Obafemi Awolowo University, Ile-Ife for providing relevant and necessary materials required for carrying out this study. Also, the author thanks the anonymous reviewers for their insightful comments and valuable suggestions.


Funding

This research did not receive any specific grant from funding agencies in the public, commercial, or not-for-profit sectors.


Conflicts of interests

The author declared that there was no conflict of interest relating to the conduct, outcome, and publication of this study.


Data availability statement

Raw data were generated from remotely sensed data. Derived data supporting the findings of this study are available from the corresponding author [A.M.] on request.


Ethics statements

Studies involving animal subjects: No animal studies are presented in this manuscript.

Studies involving human subjects:  No human studies are presented in this manuscript.

Inclusion of identifiable human data:  No potentially identifiable human images or data is presented in this study.


CRedit author statement

Conceptualization: A.M., O.A. Data curation: A.M., O.A.  Formal analysis: A.M., O.A.  Funding acquisition: No funding Investigation: A.M., O.A.  Methodology: A.M., O.A. Project administration: A.M.. Writing—original draft: A.M. Writing—review and editing: A.M., O.A.. Both authors have read and agreed to the published version of the manuscript.


References

Adedire, F. M., & Adegbile, M. B. O. (2017). Factors Influencing Housing Characteristics in Lagos Peripheral Settlements: Case of Ikorodu, Architecture Research, 7(5), 191-200. https://doi.org/10.5923/j.arch.20170705.01


Adeleye, A. O., Azeez, O. T., & Yusuff, O. I. (2014). Perception of housing quality by residents and non-residents of Ibara housing estate, Abeokuta, Ogun State, Nigeria. American Journal of Human Ecology, 3(3), 35-42. https://doi.org/10.11634/216796221504586


Arku G., Luginaah I., & Mkandawire P. (2011). Housing and health in contrasting neighbourhoods in Accra, Ghana, Journal of Social Science and Medicine, 72(11), 1864-1872. https://doi.org/10.1016/j.socscimed.2011.03.023


Asiwaju-Bello, Y. A., Olabode, F. O., Duvbiama, O. A., Iyamu, J. O., Adeyemo, A. A., & Onigbinde, M. T. (2013). Hydrochemical Evaluation of Groundwater in Akure Area, Southwestern Nigeria, for Irrigation Purpose. European International Journal of Science and Technology, 2(8), 235-249. Online: https://eijst.org.uk/images/frontImages/gallery/Vol._2_No._8/21.pdf . Accessed: September 26, 2021


Babalola, O. D., Ibem, E. O., Olotuah, A. O., & Fulani, O. A. (2016). Residents' Perception of Quality of Public Housing in Lagos, Nigeria. International Journal of Applied Environmental Sciences, 11(2), 583-598. Online: https://core.ac.uk/download/pdf/79124317.pdf . Accessed: September 26, 2021


Baer, W. C. (2014). Using housing quality to track change in the standard of living and poverty for seventeenth-century London. Historical Methods: A Journal of Quantitative and Interdisciplinary History, 47(1), 1-18. https://doi.org/10.1080/01615440.2013.800801


Brkanic, I. (2017). Housing quality assessment criteria. Electronic Journal of the Faculty of Civil Engineering Osijek-e-GFOS, 8(14), 37-47. https://doi.org/10.13167/2017.14.5


Burgess, E. W. (1925). The City: Suggestions for Investigation of Human Behaviour in the Urban Environment. Chicago: University of Chicago Press.


Coker, A., Awokola, O., Olomolaiye, P., & Booth, C. (2008). Challenges of urban housing quality and its associations with neighbourhoods’ environments: Insights and experiences of Ibadan City, Nigeria. Journal of Environmental Health Research, 7 (1), 21-30.


Creative Research Systems. Sample Size CalculatorOnline: https://www.surveysystem.com/sscalc.htm. Accessed: September 16, 2021


Daniel, O. A. (2015). Urban extreme weather: a challenge for a healthy living environment in Akure, Ondo State, Nigeria. Climate, 3(4), 775-791. https://doi.org/10.3390/cli3040775


Eades, J. S. (1980). The Yoruba to‐day (Changing Culture Series). Cambridge: Cambridge University Press.


Ezeanah, U. (2020). Quality Housing: Perception and Insights of People in Benin City, Nigeria. Urban Forum, 32 (1), 87-110. https://doi.org/10.1007/s12132-020-09409-1


Fadairo, G., & Ganiyu, S. (2010). Effects of flooding on the built environment in Akure, Nigeria. In S. Laryea, R.T.F. Leiringer, and W. Hughes (eds.), Proceedings of the West Africa Built Environment Research (WABER) Conference, Accra, Ghana, 281–287, July 27-28, 2010.


Fakunle, A., Ogundare, J., Olayinka-Alli, L., Mayowa Aridegbe, M., Bello, T., Elujulo, O., & Saliu, O. O. a. (2018). Housing Quality and Risk Factors Associated with Respiratory Health Conditions in Nigeria. In A. Almusaed, & A. Almssad (Eds.), Housing. IntechOpen. https://doi.org/10.5772/intechopen.78543


Fasakin, J. O., Basorun, J. O., Bello, M. O., Enisan, O. F., Ojo, B., & Popoola, O. O. (2018). Effect of Land Pricing on Residential Density Pattern in Akure, Nigeria. Advances in Social Sciences Research Journal, 5(1), 31-43. https://doi.org/10.14738/assrj.51.4003


Filali, R. (2012). Housing conditions in Tunisia: The quantity–quality mismatch. Journal of Housing and the Built Environment, 27(3), 317–347. https://doi.org/10.1007/s10901-012-9271-z


Gnatiuk, O., & Kryvets, O. (2018). Post-Soviet residential neighbourhoods in two second-order Ukrainian cities: Factors and models of spatial transformation. Geographica Pannonica, 22(2), 104-120. https://doi.org/10.5937/22-17037


Gough, K. V., & Yankson, P. W. (2000). Land Markets in African Cities: The Case of Peri-urban Accra, Ghana. Urban Studies, 37(13), 2485-2500. https://doi.org/10.1080/00420980020080651


Haque, I., Rana, M. J., & Patel, P. P. (2020). Location matters: Unravelling the spatial dimensions of neighbourhood level housing quality in Kolkata, India. Habitat International, 99, 102157. https://doi.org/10.1016/j.habitatint.2020.102157


Harris, C. D., & Ullman, E. L. (1945). The Nature of Cities. The Annals of the American Academy of Political and Social Sciences, 242(1), 7–17. https://doi.org/10.1177/000271624524200103


Hoyt, H. (1939). The Structure and Growth of Residential Neighbourhoods in American Cities. Washington: Federal Housing Administration.


Hsu, C. I., & Guo, S. P. (2006). CBD Oriented Commuters & Mode and Residential Location Choices in an Urban Area with surface Streets and Rail Transit Lines. Journal of Urban Planning and Development, 132(4), 235-246. https://doi.org/10.1061/(ASCE)0733-9488(2006)132:4(235)


Ibitoye M. O., Aderibigbe O. G., Adegboyega S. A., & Adebola A. O. (2017). Spatio-temporal Analysis of Land Surface Temperature Variations in the Rapidly Developing Akure and its Environs, Southwestern Nigeria using Land Sat Data. Ethiopian Journal of Environmental Studies and Management 10(3), 389-403. https://doi.org/10.4314/ejesm.v10i3.9


Jiboye, A. D. (2010). Post-occupancy evaluation of residential satisfaction in Lagos, Nigeria: Feedback for residential improvement. Frontiers of Architectural Research, 1(3), 236–243. https://doi.org/10.1016/j.foar.2012.08.001


Jochem, W. C., Bird, T. J., & Tatem, A. J. (2018). Identifying residential neighbourhood types from settlement points in a machine learning approach. Computers, environment and urban systems, 69, 104-113. https://doi.org/10.1016/j.compenvurbsys.2018.01.004


Kearney, A. (2006). Residential Development Patterns and Neighbourhood Satisfaction Impacts of Density and Nearby Nature. Environment and Behaviour, 38(1), 112-139. https://doi.org/10.1177/0013916505277607


Konadu-Agyemang, K. (2001). A survey of housing conditions and characteristics in Accra, an African city. Habitat International, 25(1), 15–34. https://doi.org/10.1016/S0197-3975(00)00016-3


Kurniati, R., & Erlambang, F. R. (2015). Changes the Pattern of Residential Space into Commercial Space in Chinatown Semarang. Procedia Environmental Sciences, 23, 307-314. https://doi.org/10.1016/j.proenv.2015.01.045


Morenikeji, W., Umaru, E., Pai, H., Jiya, S., Idowu, O., & Adeleye, B. M. (2017). Spatial analysis of housing quality in Nigeria. International Journal of Sustainable Built Environment, 6(2), 309-316. https://doi.org/10.1016/j.ijsbe.2017.03.008


Myung-Jin, J. (2013). The effects of housing preference for an apartment on residential location choice in Seoul: A random bidding land use simulation approach. Land Use Policy, 35, 395-405. https://doi.org/10.1016/j.landusepol.2013.06.011


National Bureau of Statistics (2021). Demographic Statistics Bulletin. Nigeria: Abuja: Demographic Statistics Division.


National Population Commission of Nigeria (2006). 2006 National Population Census Results. Abuja, National Office of Statistics.


Ogu V. I. (2002). Urban residential satisfaction and the planning implication in a developing world context: The example of Benin City, Nigeria, International Planning Studies, 7, 37-53. https://doi.org/10.1080/13563470220112599


Omole K. F. (2010). An Assessment of Housing Condition and Socio-Economic Life Styles of Slum Dwellers in Akure, Nigeria. Contemporary Management Research, 6(4), 272-290. https://doi.org/10.7903/cmr.2980


Ondo State Government (2015). Ondo State Ministry of Agriculture and Natural Resources (OSMANR). Akure: Government Press.


Owoeye, J. & Ogundiran, A. (2014). A study on housing and environmental quality of Moniya Community in Ibadan, Nigeria. Journal of Environment and Earth Science, 4(13), 51-60. Online: https://core.ac.uk/download/pdf/234663526.pdf . Accessed: September 28, 2021.


Page, I. C. & Gordon, G. (2017). What is Quality in Buildings? New Zealand: BRANZ Ltd.


Premier, A. (2021). Developing place attachment in high-density residential neighbourhoods in China: comparing the role of shared outdoor environments in two residential models in Qingdao. Sustainable Cities and Landscapes, University of Auckland, 1-10


Rajaei, S. A., & Mansourian, H. (2017). Urban growth and housing quality in Iran. Social Indicators Research, 131(2), 587-605. https://doi.org/10.1007/s11205-016-1260-2


Ren, H., Yuan, N. & Hu, H. (2019). Housing quality and its determinants in rural China: a structural equation model analysis. Journal of Housing and the Built Environment, 34(1), 313-329. https://doi.org/10.1007/s10901-018-9629-y


Salami, K. K. (2016). Housing facilities and realities of health of the elderly in Nigerian cities. Nigerian Journal of Economics and Social Studies, 58(1), 53-75. Online: https://www.researchgate.net/publication/330987051. Accessed: March 16, 2022


Satu, S. A., & Chiu, R. L. (2019). Livability in dense residential neighbourhoods of Dhaka. Housing Studies, 34(3), 538-559. https://doi.org/10.1080/02673037.2017.1364711


Sinha, P., Verma, N. K., & Ayele, E. (2016). Urban built-up area extraction and change detection of Adama municipal area using time-series Landsat images. International Journal of Advanced Remote Sensing and GIS, 5(8), 1886-1895. https://doi.org/10.23953/cloud.ijarsg.67


Streimikiene, D. (2015). Quality of life and housing. International Journal of Information and Education Technology, 5(2), 140-145. https://doi.org/10.7763/IJIET.2015.V5.491


Sweis, R. J., Shanak, R. O., El Samen, A. A., & Suifan, T. (2014). Factors affecting quality in the Jordanian housing sector. International J. of Housing Markets and Analysis, 7, 175-188. https://doi.org/10.1108/IJHMA-01-2013-0004


Thomas, O. S. & Hassan, O. A. (2018). Assessment of Factors Influencing Housing Quality in the Coastal Community. International Journal of Innovation and Sustainability, 2, 1-8. Online SSRN: https://ssrn.com/abstract=3138142. Accessed: February 13, 2022


Wimalasena, N. N., Chang-Richards, A., Wang, K. & Dirks, K., (2022). Housing quality indicators: A systematic review. In: Sandanayake, Y.G., Gunatilake, S. & Waidyasekara, K.G.A.S. (eds). Proceedings of the 10th World Construction Symposium, pp. 531-544. June, 2022, Sri Lanka. https://doi.org/10.31705/WCS.2022.43


Yoade, A. O., Adeyemi, O. O., & Adeyemi, B. B. (2015). An assessment of housing and neighbourhood quality condition in Ilesa, Nigeria. Analele Universitatii Oradea, SeriaGeografie, 25(2), 242-252. Online: http://istgeorelint.uoradea.ro/Reviste/Anale/anale.htm. Accessed: February 13, 2022.


Yoade, A., Adeyemi, O., & Yoade, O. (2018). Assessment of Housing Quality in Ede, Nigeria. Asian Themes in Social Sciences Research, 1(2), 76–83. https://doi.org/10.33094/journal.139.2018.12.76.83


Zainal, N. R., Kaur, G., Ahmad, N. A., & Khalili, J. M. (2012). Housing conditions and quality of life of the urban poor in Malaysia. Procedia-Social and Behavioral Sciences, 50, 827-838. https://doi.org/10.1016/j.sbspro.2012.08.085


Zanon, S., Callegaro, N., & Albatici, R. (2019). A novel approach for the definition of an integrated visual quality index for residential buildings. Applied Sciences, 9(8), 1579. https://doi.org/10.3390/app9081579


Zhonghua, H., & Xuejun, D. (2015). Assessment and determinants of residential satisfaction with public housing in Hangzhou, China. Habitat International, 47, 218-230.  https://doi.org/10.1016/j.habitatint.2015.01.025


*Corresponding Author: 

Department of Geography, Obafemi Awolowo University, Ile-Ife, Nigeria

Email address: amolayiwola@oauife.edu.ng     


How to cite this article:

Olayiwola, A. M., & Ajala, O. A. (2022). Correlation between Socio-Economic Characteristics and Housing Quality of Residential Neighbourhoods in Akure, Southwest Nigeria. Journal of Contemporary Urban Affairs, 6(2), 217-231. https://doi.org/10.25034/ijcua.2022.v6n2-8